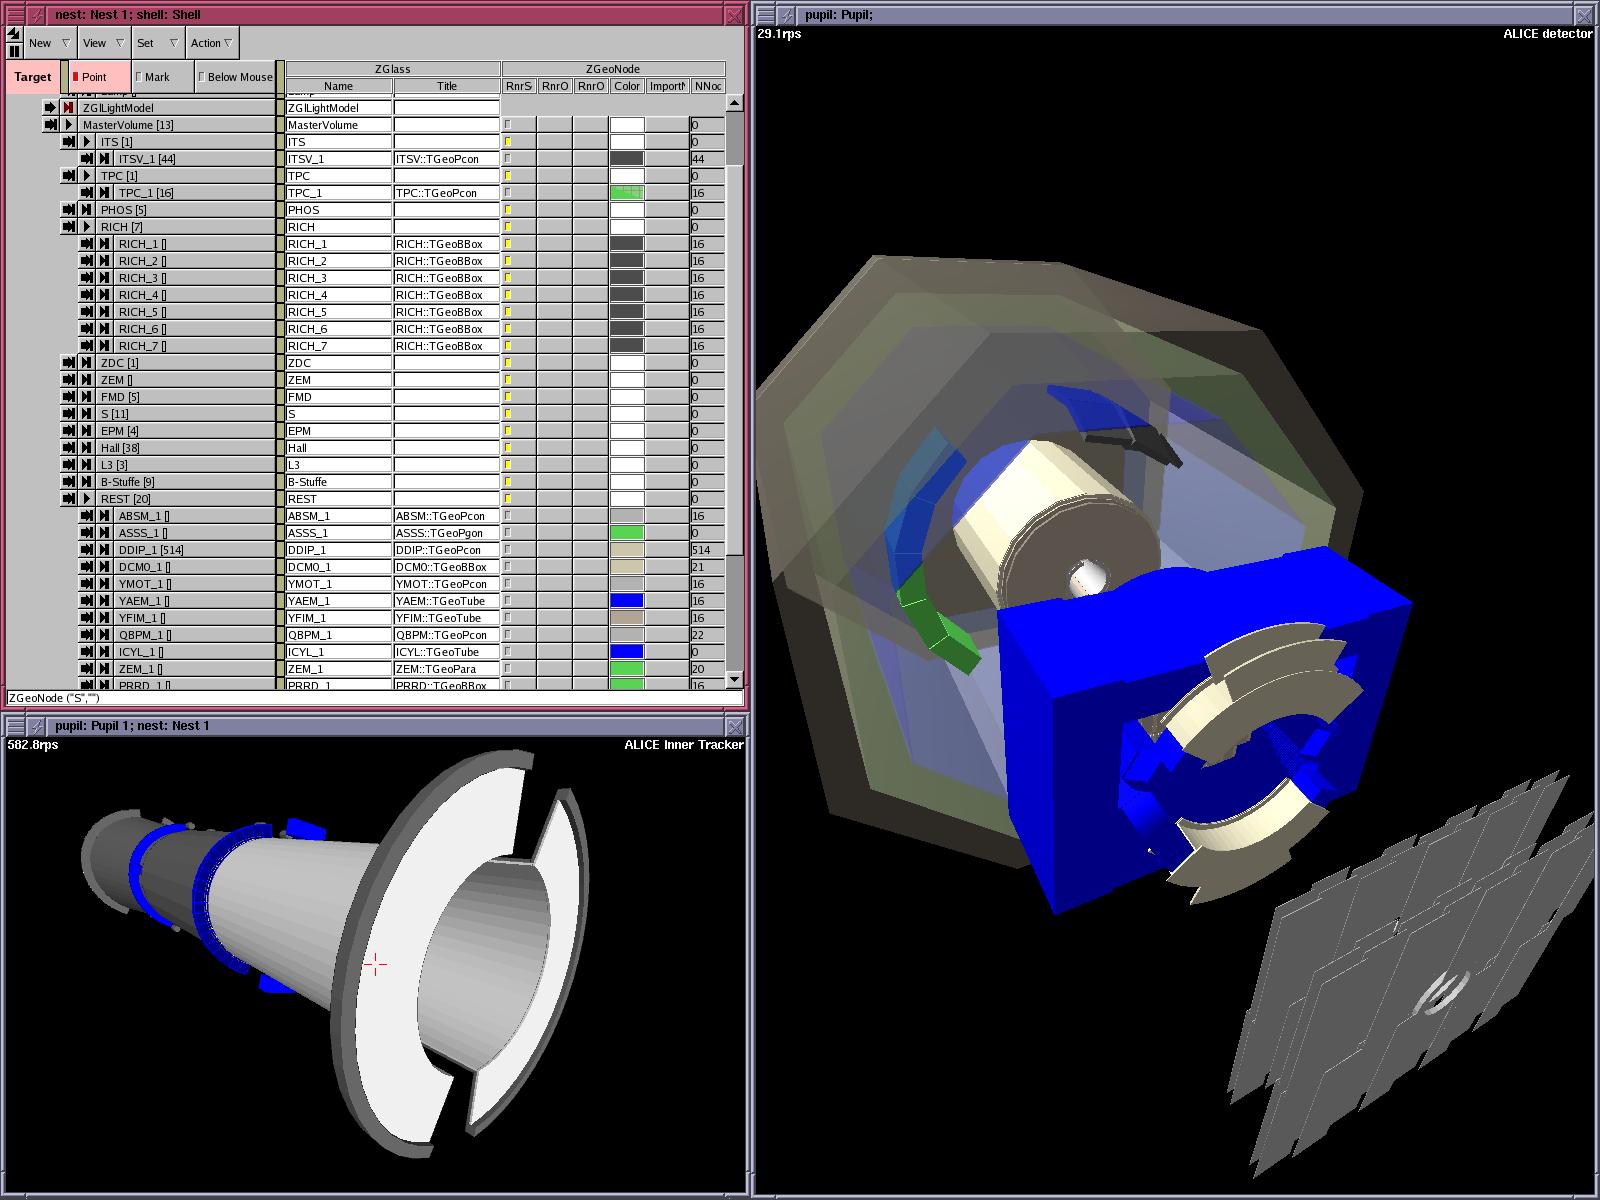
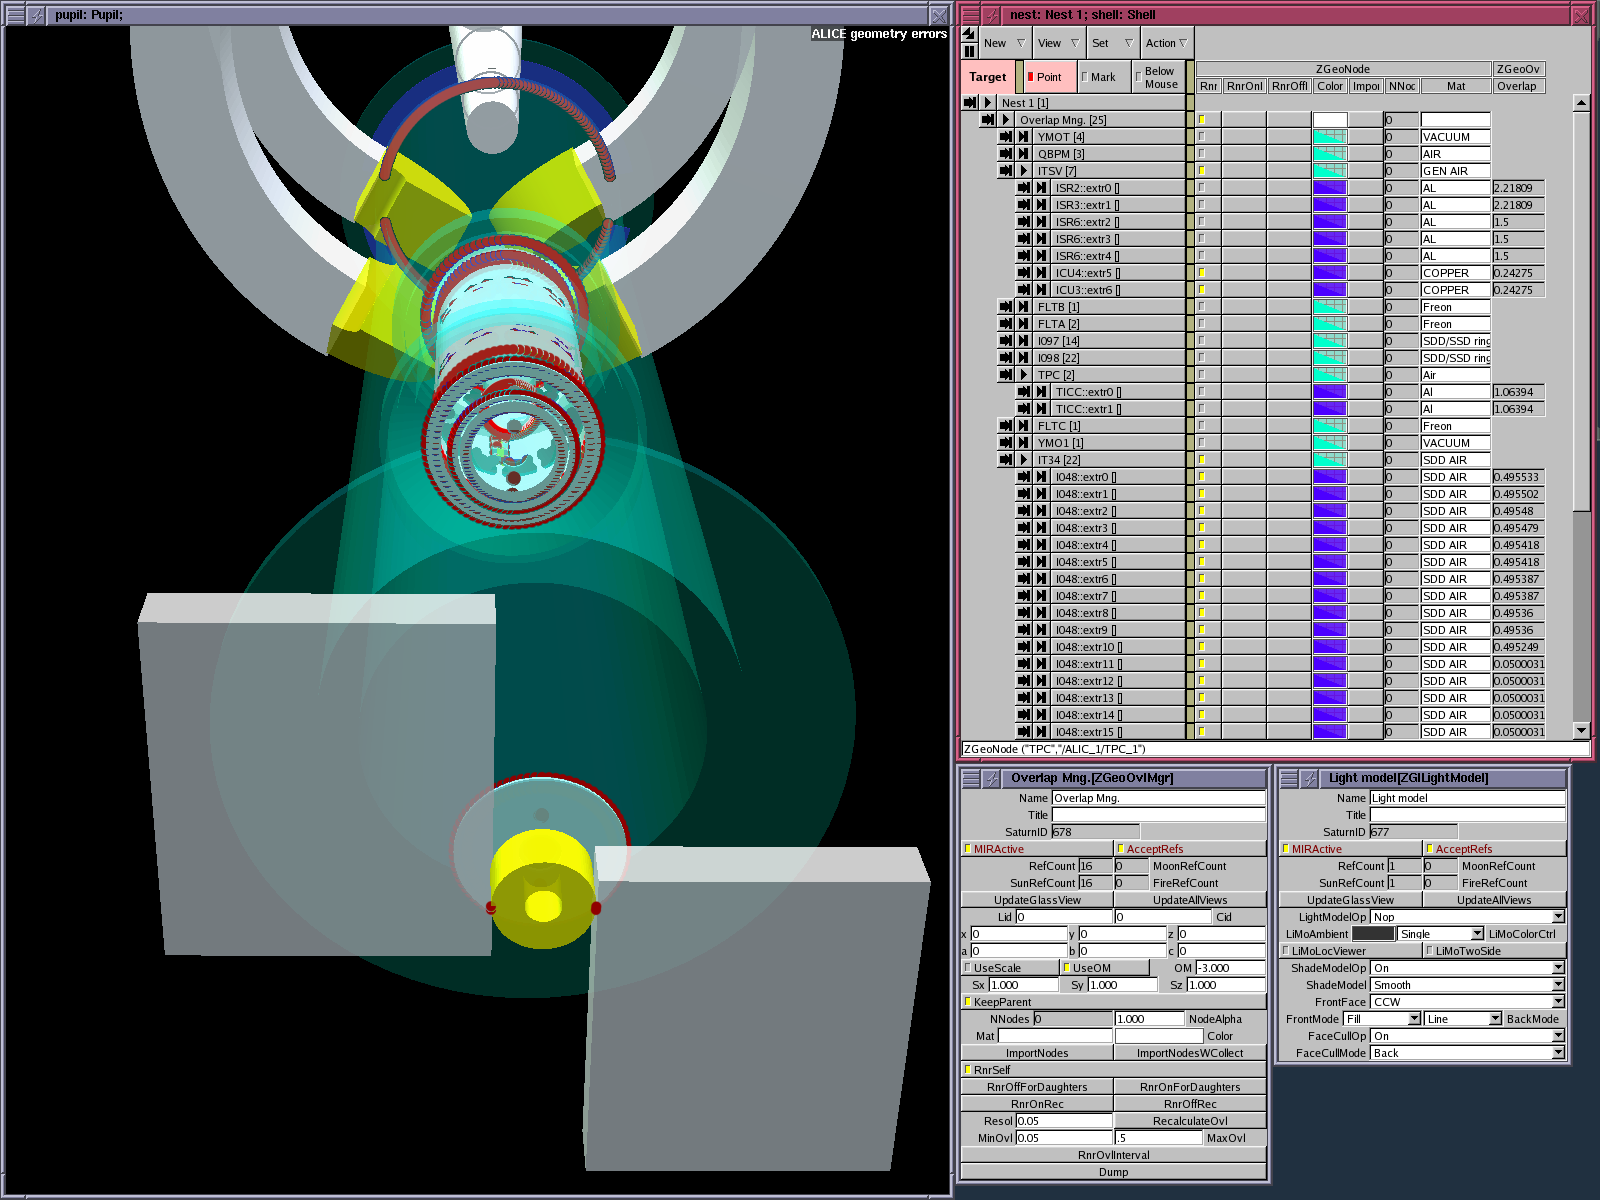
ALICE geometry: a) geo-volume browser; b) overlaps and extrusions
Event display is an application offering "graphical user interface to" and "visualization of":
detector geometry
event data
simulation records: kinematics, hits
raw data
reconstructed objects: clusters, tracks, VO's, primary vertex
reconstruction & analysis algorithms
grid interface for visualization of remote-data and resources
calibration and alignment data
simulation algorithms
on-line monitoring
detailed detector status
visual debugging ---> need complex selections and simultaneous display of many elements
facilitate preparation of "scientific results" and "documentary material"
help users understand the detector, event structure and reconstruction algorithms
presentations, demonstrations & outreach activities
Very wide ---> "event display" is a many headed dragon.
Instead of designing it as a monolithic application ... build the skeleton and internal organs first. Call these an
Common base on which different and specialized front-ends can be attached (eg. for on-line monitoring).
Basic elements/operations:
convert ALICE data into visualization-optimized structures
ALICE is an extreme case (event size, # of tracks)
visualization of basic components (geometry, kinematics, hits, ...)
provide mechanisms for data-selection
queries that consider simulated AND reconstructed data (cross-selections)
open design ---> allow extensions/specializations by user-code on all levels
support for custom front-end building
Absolute prerequisite --- the mother of everything.
Rely heavily on ROOT I/O and advanced features of TTree's (indices, friends).
Ideally would only need a thin library including:
data-structures
I/O steering & state management
selection algorithms
visualization code
ALICE specific part mandatory for:
data conversion
raw-data or digit visualization
interaction with reconstruction & analysis algorithms
It should be possible to run basic visualization without ALICE libraries.
ROOT-based framework for object-collection management, dynamic visualization & distributed computing (http://www.gled.org/).
allows rapid code development and provides powerful GUI elements for object interaction (setting values, calling methods, browsing)
flexible and modular OpenGL rendering infrastructure
directly supports multi-threaded execution (threaded method execution and exclusion locks provided at the base-class level)
Complete: reading & displaying all levels of ALICE data
Prototype: can be somewhat sloppy about implementation details; provide only rudimentary GUI elements
Needed to:
estimate operational parameters (memory consumption, execution speed, rendering refresh rate)
develop, test and assess selection mechanisms and display modes
see how it looks ---> find reasonable default representations
allow early users to try it out and influence further development
The prototye is basically done.
Sorely missing: visualization of digits raw-data (only TPC done).
Family project: Alja working since mid Nov-04, I began contributing directly in Jan-05
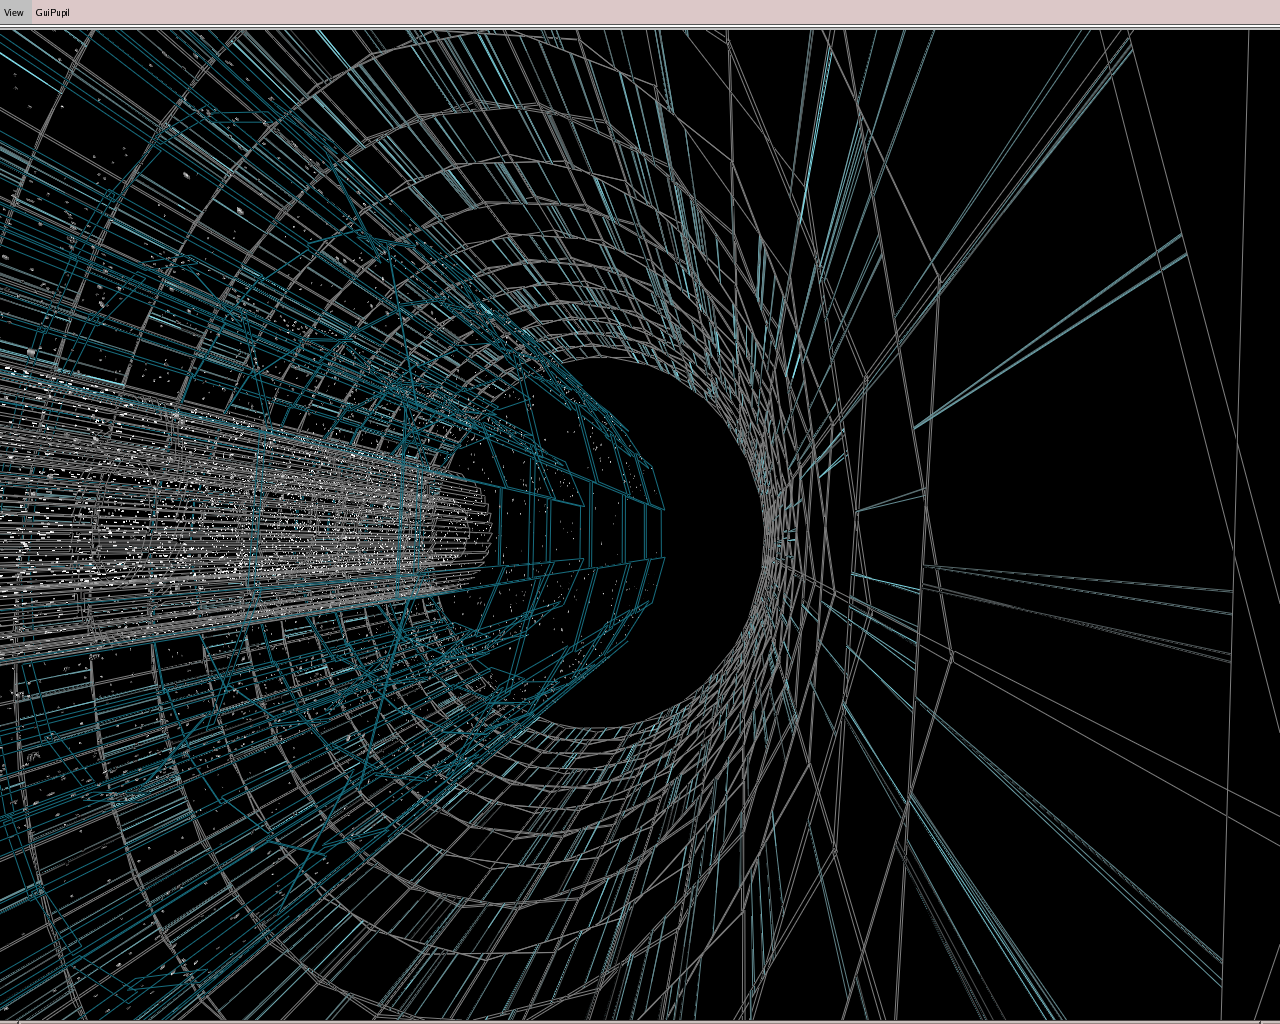
ROOT geometry (TGeo) visualization
basic interface to AliROOT; kinematics
simulated hits, TPC digits
TPC clusters, reconstructed tracks and V0's, prototype of cross-selections
ITS clusters (trivial) and digits (painful)
No separation on ALICE specific .vs. VisCore part yet.
Read ALICE data and produce Visualization Summary Data (VSD) file.
The VSD can be read back and used without the presence of ALICE data.
A general visualization tool for ROOT TGeo geometries
Features:
loading from ROOT file; selection of volumes for browsing/viewing
interface to overlap checking
export simplified geometry
save visual representation of geometry (volume selection, colors)
ALICE geometry: a) geo-volume browser; b) overlaps and extrusions
Kinematics done
Hits done for ITS, TPC, TRD, TOF (easy to add others)
TPC hits are thinned by a factor of 10.
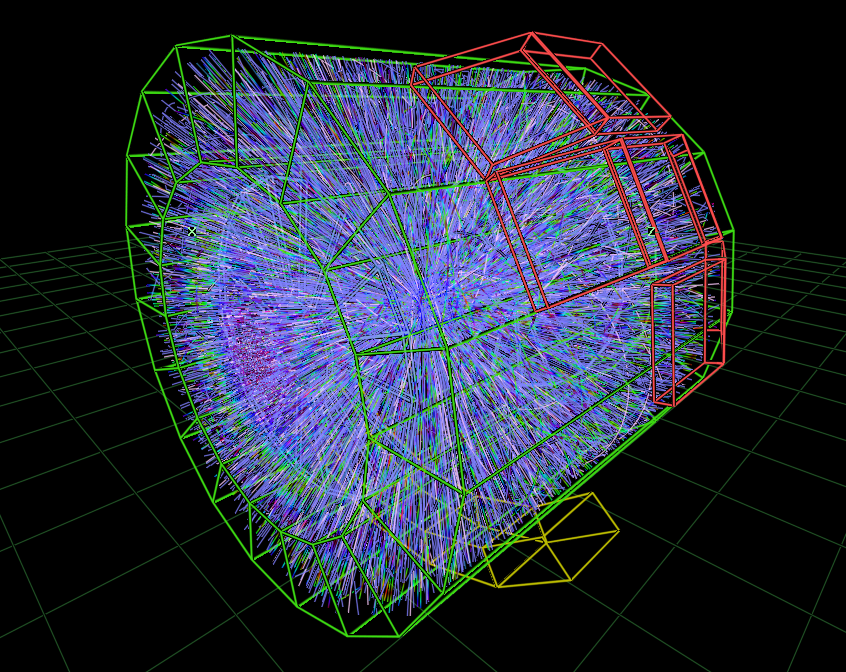
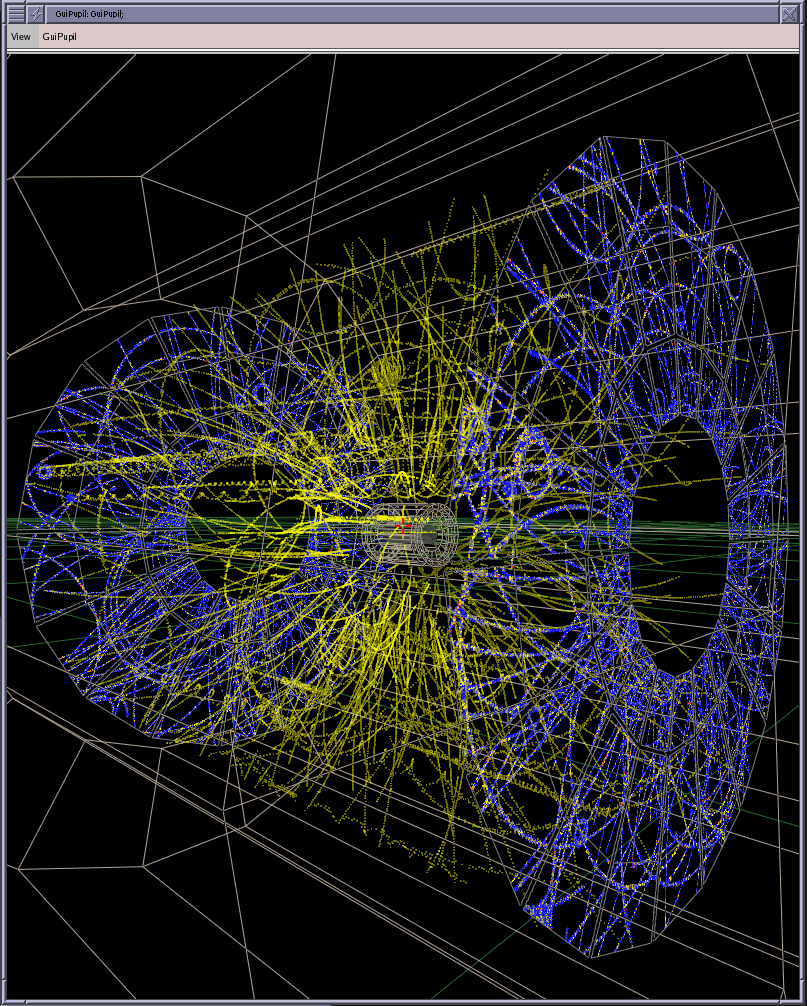
a) primary charged particles in a central event; b) kinematics and hits
Done for TPC and ITS.
Clusters for other sub-detectors easy to add.
Digits diplay is detector specific, need further input.
Creating a complete digit-viewer is a daunting task (need special layout of elements, navigation mechanisms, histogram output ...).
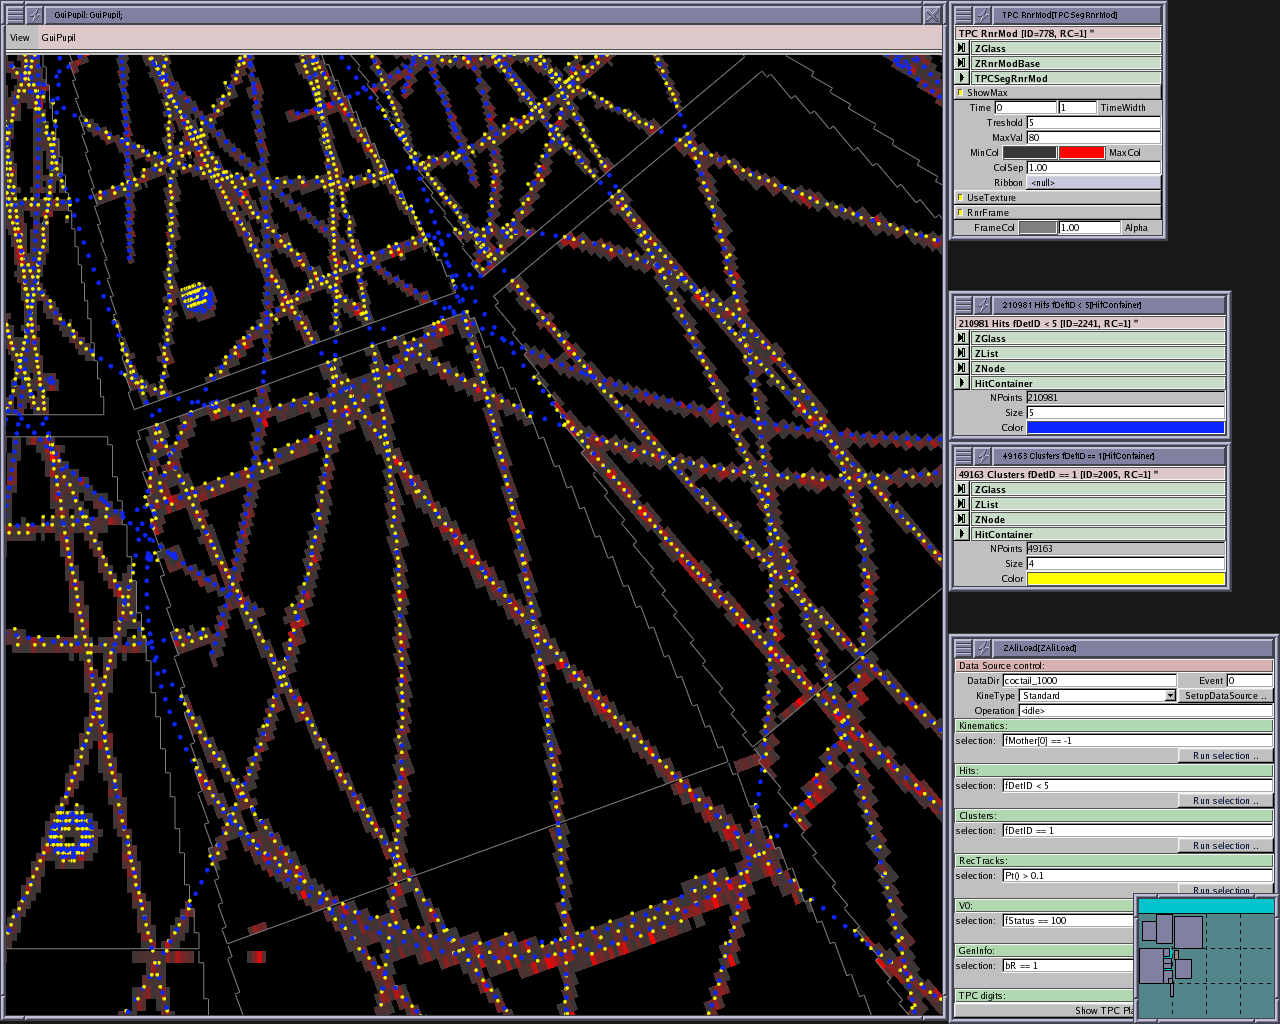
a) TPC clusters and digits; b) hits also added
Maximal pad-value is drawn.
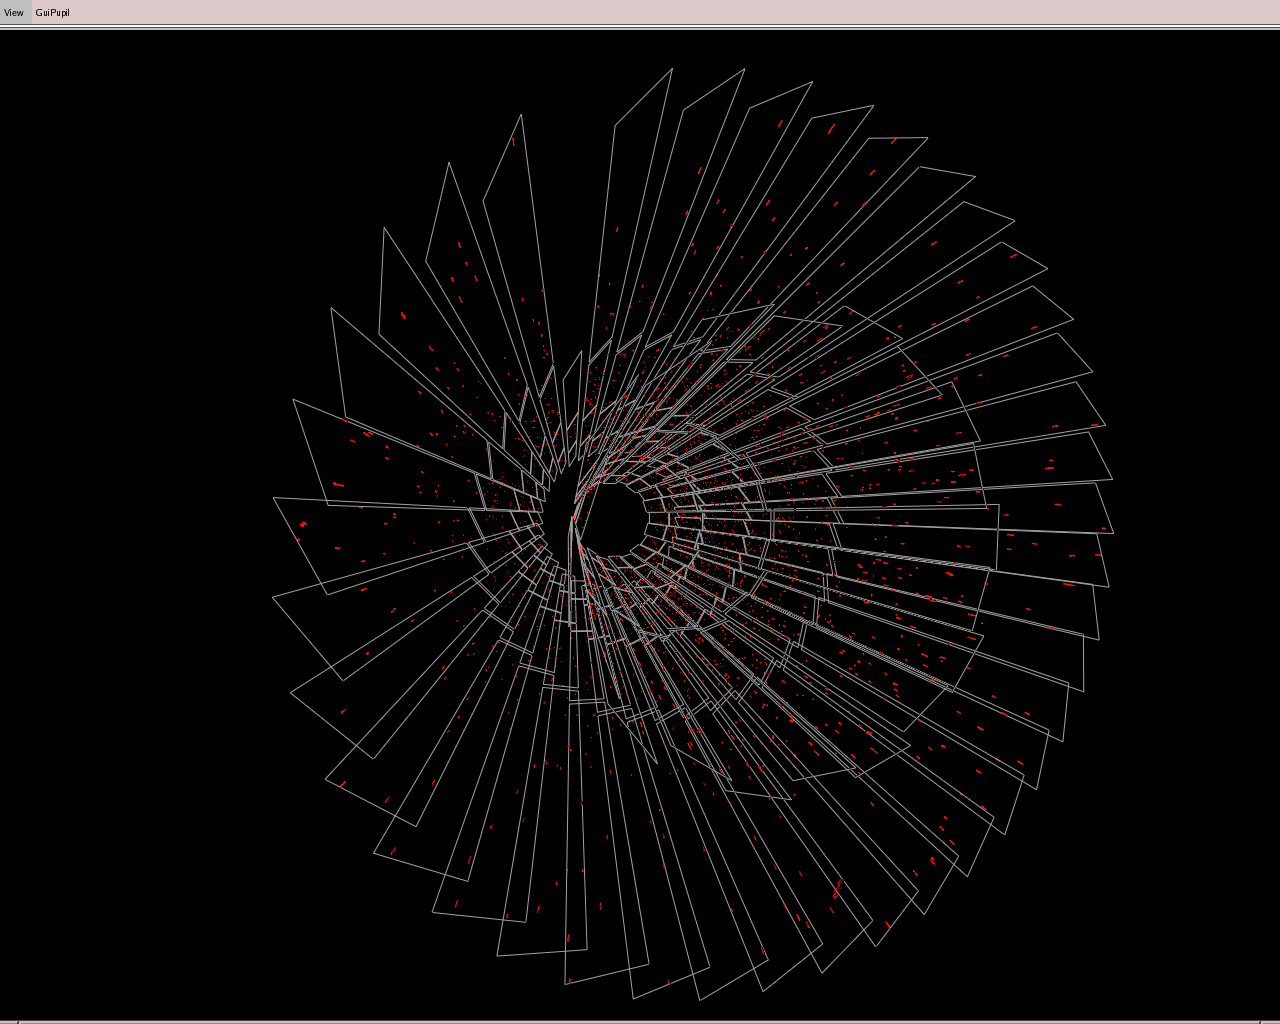
a) coctail 10k: full its digits; b) small event (coctail 100): z-view of ITS clusters and reconstructed tracks
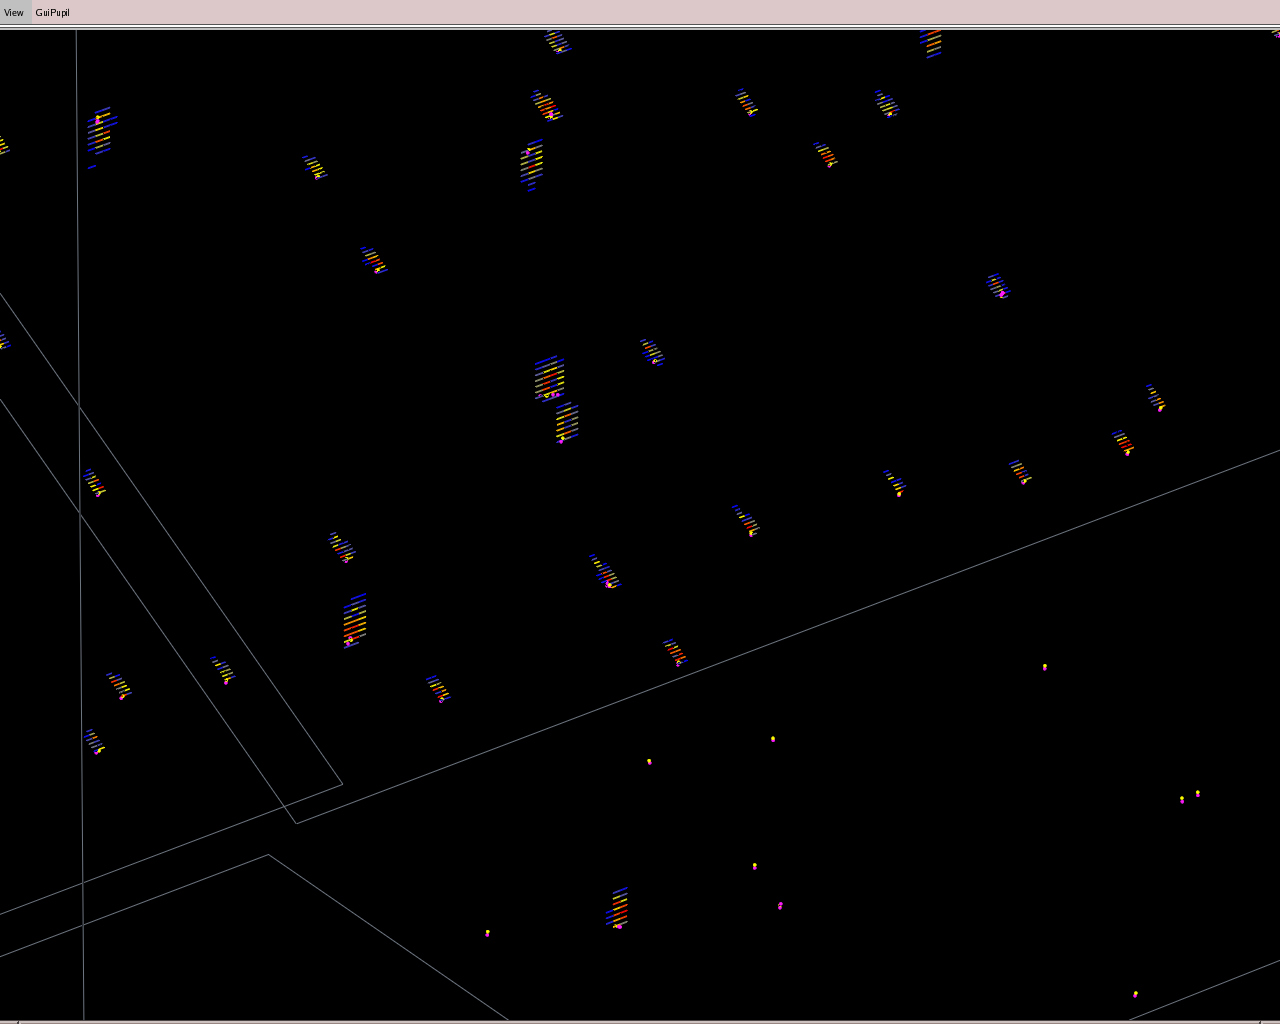
coctail 10k: a) pixels; b) silicon drift
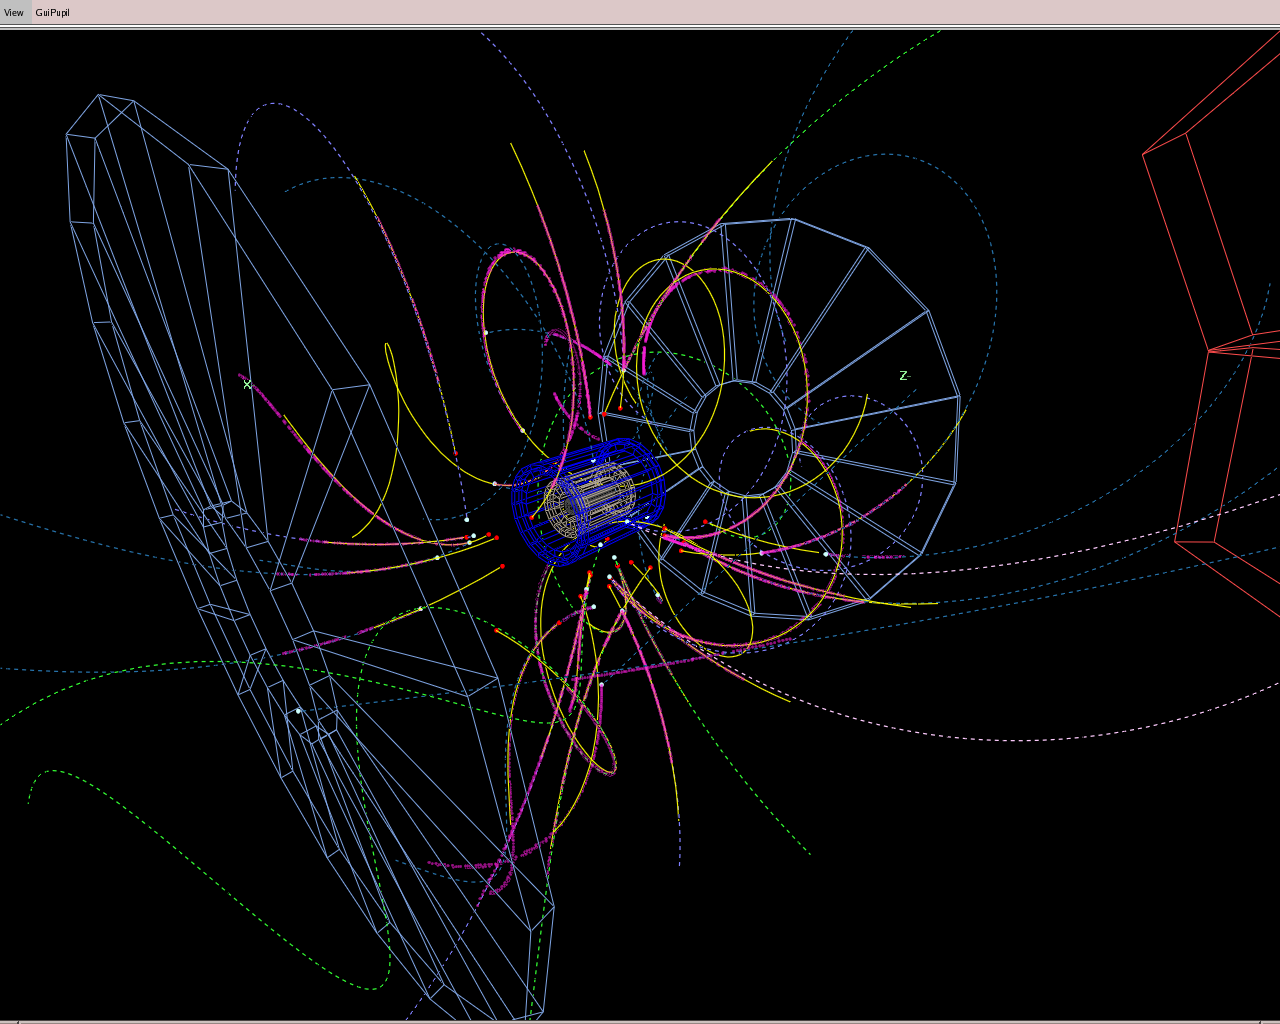
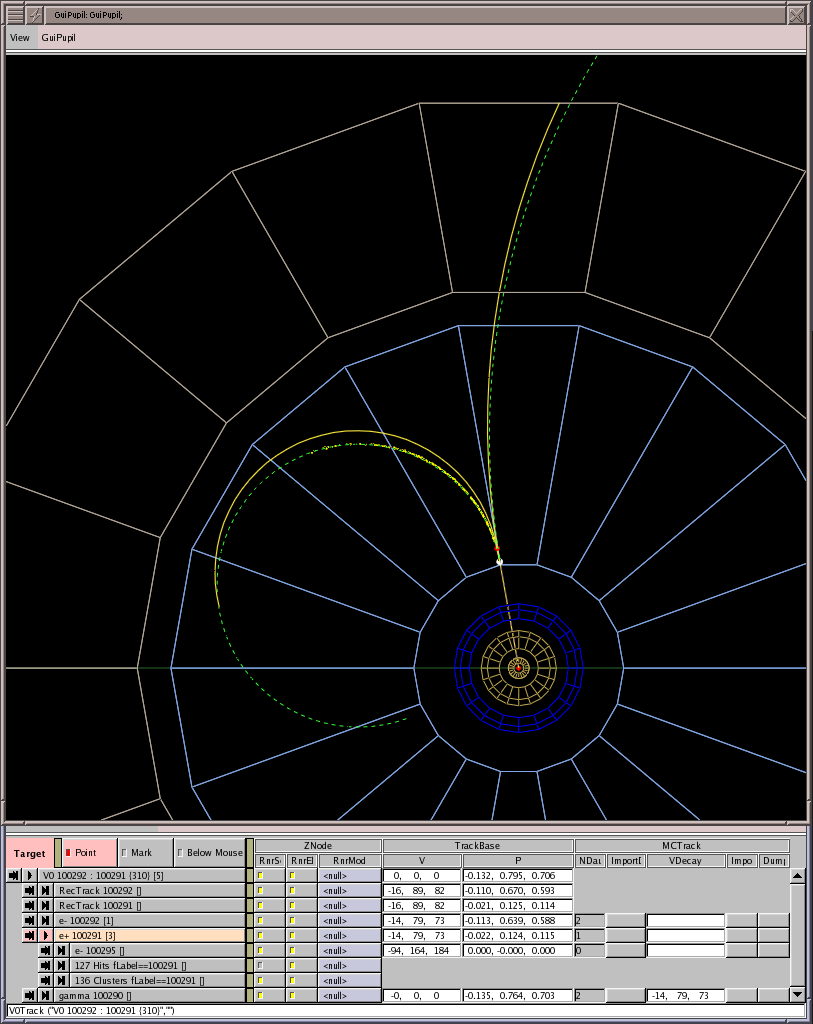
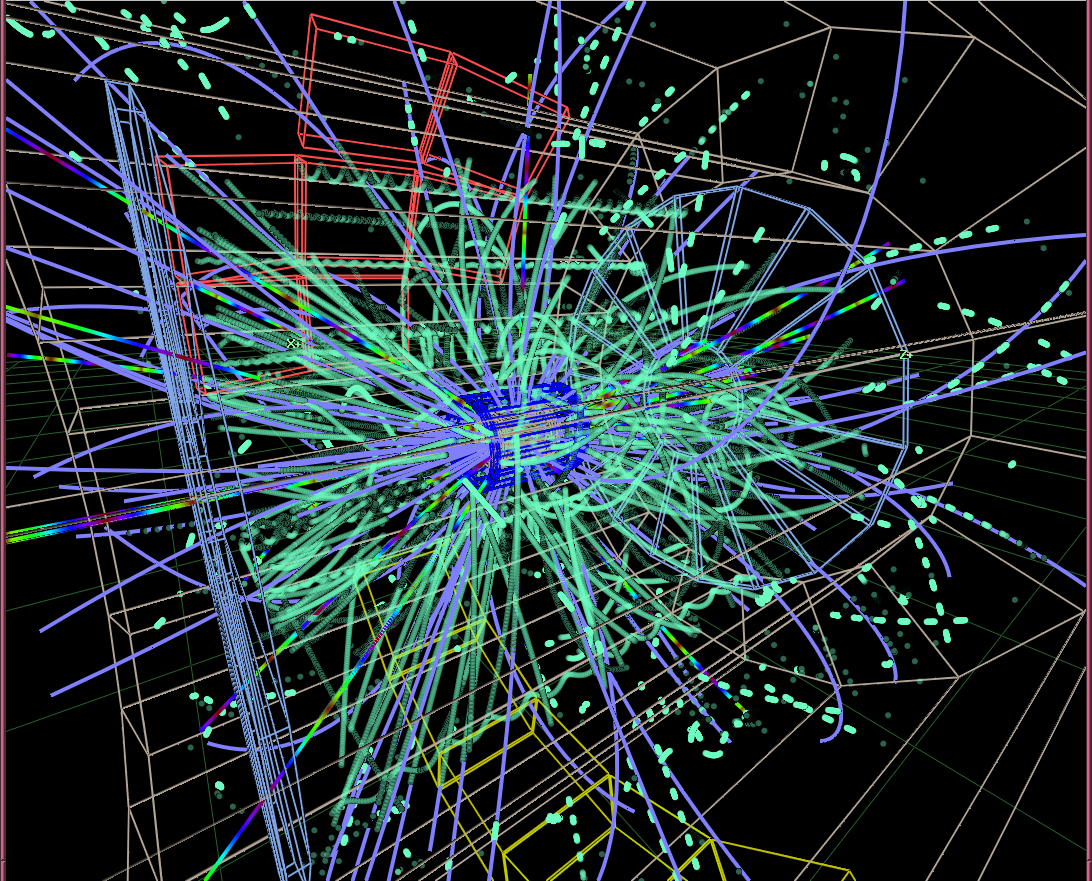
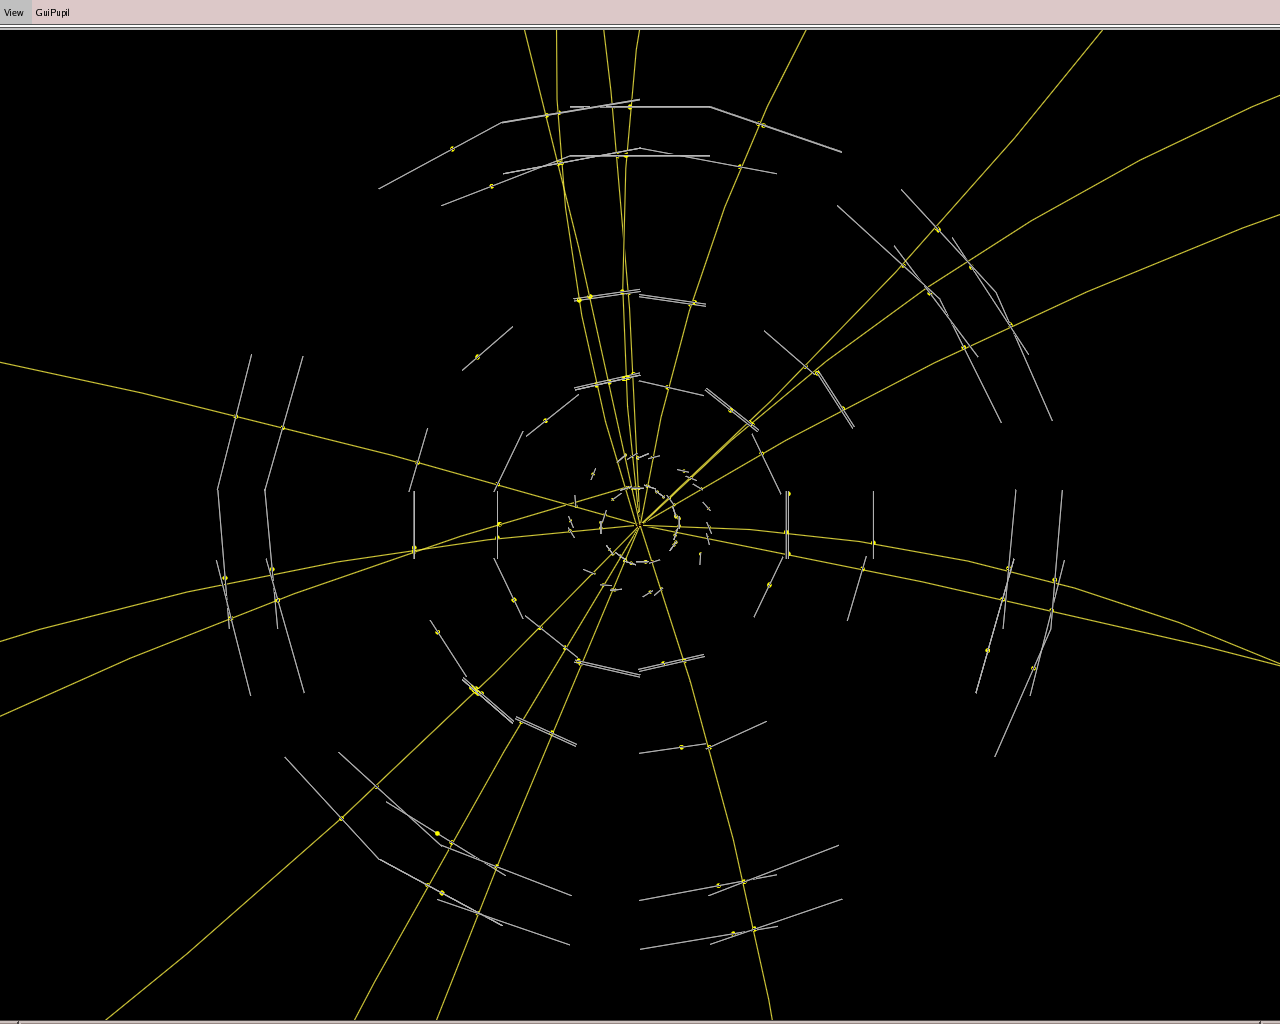
a) Reconstructed tracks, clusters and kinematics; b) reconstructed V0
Installation available on afs, eg:
/afs/cern.ch/alice/library/gled/bin/aligled -- AliLoader.C
Use 'aligled -help' to get confused.
Available scripts:
If possible, use hardware accelerated graphics drivers.
For ATI and NVIDIA this might help http://www-f9.ijs.si/~matevz/ati_nvidia/
To navigate in the 3D window, use:
 left-drag          forward/backwards slide left/right
 ctrl-left-drag     slide up/down     slide left/right
 mid-drag           turn up/down      turn left/right
 ctrl-mid-drag      turn down/up      roll left/right
 <Home>		    return to the origin
 <F1>               spawn view-control window
 <F2>               spawn camera-position window
Some documentation available from http://www.gled.org/docs/. Somewhat rotten and/or incomplete, but not misleading.
Functionality: be pragmatic and opportunistic
keep the prototype working (in case somebody needs a picture for his talk)
fill-in the missing parts and extend it to accommodate user's needs
raw-data visualization
Framework structure:
separate ALICE specific part
prepare mechanisms for attachment of specialized GUI front-ends (especially for pure ROOT GUI)
bridge the gaps between ROOT and GLED GUI & OpenGL rendering