#include "TBinomialEfficiencyFitter.h"
#include "TVirtualFitter.h"
#include "TH1.h"
#include "TRandom3.h"
#include "TF1.h"
#include "TStyle.h"
#include "TCanvas.h"
#include "TLegend.h"
#include "TPaveStats.h"
#include <cassert>
#include <iostream>
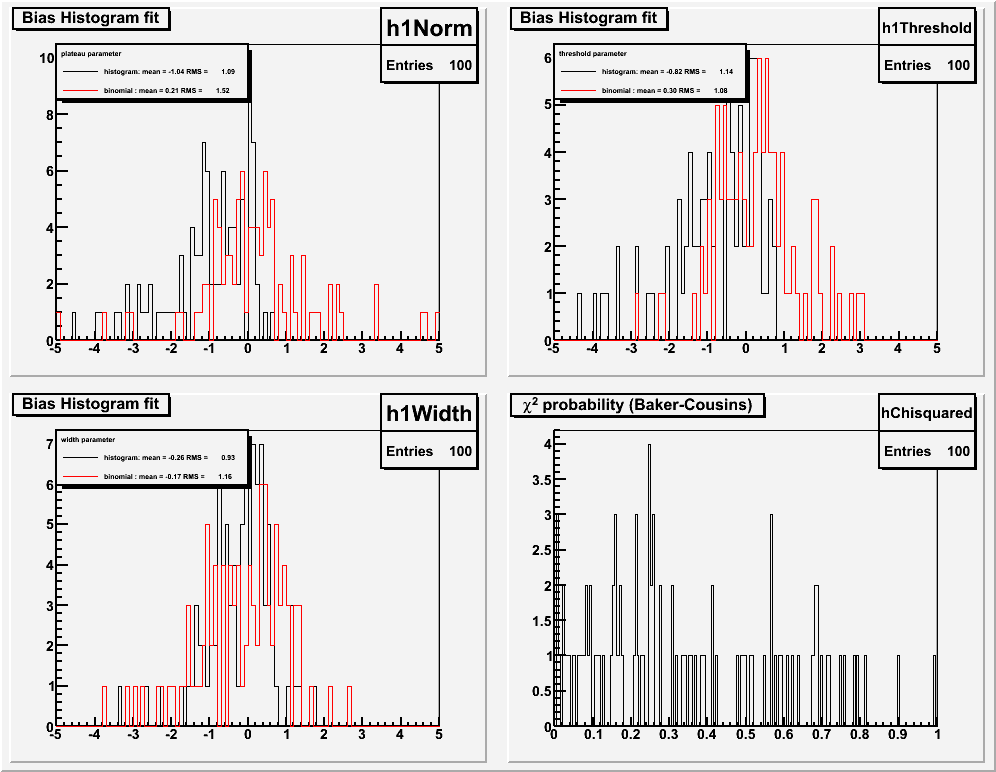
void TestBinomial(int nloop = 100, int nevts = 100, bool plot=false)
{
gStyle->SetMarkerStyle(20);
gStyle->SetLineWidth(2.0);
gStyle->SetOptStat(11);
TObjArray hbiasNorm;
hbiasNorm.Add(new TH1D("h0Norm", "Bias Histogram fit",100,-5,5));
hbiasNorm.Add(new TH1D("h1Norm","Bias Binomial fit",100,-5,5));
TObjArray hbiasThreshold;
hbiasThreshold.Add(new TH1D("h0Threshold", "Bias Histogram fit",100,-5,5));
hbiasThreshold.Add(new TH1D("h1Threshold","Bias Binomial fit",100,-5,5));
TObjArray hbiasWidth;
hbiasWidth.Add(new TH1D("h0Width", "Bias Histogram fit",100,-5,5));
hbiasWidth.Add(new TH1D("h1Width","Bias Binomial fit",100,-5,5));
TH1D* hChisquared = new TH1D("hChisquared",
"#chi^{2} probability (Baker-Cousins)", 200, 0.0, 1.0);
Double_t xmin =10, xmax = 100;
TH1D* hM2D = new TH1D("hM2D", "x^(-2) denominator distribution",
45, xmin, xmax);
TH1D* hM2N = new TH1D("hM2N", "x^(-2) numerator distribution",
45, xmin, xmax);
TH1D* hM2E = new TH1D("hM2E", "x^(-2) efficiency",
45, xmin, xmax);
TF1* fM2D = new TF1("fM2D", "(1-[0]/(1+exp(([1]-x)/[2])))/(x*x)",
xmin, xmax);
TF1* fM2N = new TF1("fM2N", "[0]/(1+exp(([1]-x)/[2]))/(x*x)",
xmin, xmax);
TF1* fM2Fit = new TF1("fM2Fit", "[0]/(1+exp(([1]-x)/[2]))",
xmin, xmax);
TF1* fM2Fit2 = 0;
TRandom3 rb(0);
Double_t norm = 0.80;
Double_t threshold = 25.0;
Double_t width = 5.0;
fM2D->SetParameter(0, norm);
fM2D->SetParameter(1, threshold);
fM2D->SetParameter(2, width);
fM2N->SetParameter(0, norm);
fM2N->SetParameter(1, threshold);
fM2N->SetParameter(2, width);
Double_t integralN = fM2N->Integral(xmin, xmax);
Double_t integralD = fM2D->Integral(xmin, xmax);
Double_t fracN = integralN/(integralN+integralD);
Int_t nevtsN = rb.Binomial(nevts, fracN);
Int_t nevtsD = nevts - nevtsN;
gStyle->SetOptFit(1111);
for (int iloop = 0; iloop < nloop; ++iloop) {
hM2D->Reset();
hM2N->Reset();
hM2D->FillRandom(fM2D->GetName(), nevtsD);
hM2N->FillRandom(fM2N->GetName(), nevtsN);
hM2D->Add(hM2N);
hM2N->Sumw2();
hM2E->Divide(hM2N, hM2D, 1, 1, "b");
fM2Fit->SetParameter(0, 0.5);
fM2Fit->SetParameter(1, 15.0);
fM2Fit->SetParameter(2, 2.0);
fM2Fit->SetParError(0, 0.1);
fM2Fit->SetParError(1, 1.0);
fM2Fit->SetParError(2, 0.2);
TCanvas* cEvt;
if (plot) {
cEvt = new TCanvas(Form("cEnv%d",iloop),
Form("plots for experiment %d", iloop),
1000, 600);
cEvt->Divide(1,2);
cEvt->cd(1);
hM2D->DrawCopy("HIST");
hM2N->SetLineColor(kRed);
hM2N->DrawCopy("HIST SAME");
cEvt->cd(2);
}
for (int fit = 0; fit < 2; ++fit) {
Int_t status = 0;
switch (fit) {
case 0:
hM2E->Fit(fM2Fit, "RN");
if (plot) {
hM2E->DrawCopy("E");
fM2Fit->DrawCopy("SAME");
}
break;
case 1:
if (fM2Fit2) delete fM2Fit2;
fM2Fit2 = dynamic_cast<TF1*>(fM2Fit->Clone("fM2Fit2"));
if (fM2Fit2->GetParameter(0) >= 1.0)
fM2Fit2->SetParameter(0, 0.95);
fM2Fit2->SetParLimits(0, 0.0, 1.0);
TBinomialEfficiencyFitter bef(hM2N, hM2D);
status = bef.Fit(fM2Fit2,"RI");
if (status!=0) {
std::cerr << "Error performing binomial efficiency fit, result = "
<< status << std::endl;
continue;
}
if (plot) {
fM2Fit2->SetLineColor(kRed);
fM2Fit2->DrawCopy("SAME");
}
}
if (status != 0) break;
Double_t fnorm = fM2Fit->GetParameter(0);
Double_t enorm = fM2Fit->GetParError(0);
Double_t fthreshold = fM2Fit->GetParameter(1);
Double_t ethreshold = fM2Fit->GetParError(1);
Double_t fwidth = fM2Fit->GetParameter(2);
Double_t ewidth = fM2Fit->GetParError(2);
if (fit == 1) {
fnorm = fM2Fit2->GetParameter(0);
enorm = fM2Fit2->GetParError(0);
fthreshold = fM2Fit2->GetParameter(1);
ethreshold = fM2Fit2->GetParError(1);
fwidth = fM2Fit2->GetParameter(2);
ewidth = fM2Fit2->GetParError(2);
hChisquared->Fill(fM2Fit2->GetProb());
}
TH1D* h = dynamic_cast<TH1D*>(hbiasNorm[fit]);
h->Fill((fnorm-norm)/enorm);
h = dynamic_cast<TH1D*>(hbiasThreshold[fit]);
h->Fill((fthreshold-threshold)/ethreshold);
h = dynamic_cast<TH1D*>(hbiasWidth[fit]);
h->Fill((fwidth-width)/ewidth);
}
}
TCanvas* c1 = new TCanvas("c1",
"Efficiency fit biases",10,10,1000,800);
c1->Divide(2,2);
TH1D *h0, *h1;
c1->cd(1);
h0 = dynamic_cast<TH1D*>(hbiasNorm[0]);
h0->Draw("HIST");
h1 = dynamic_cast<TH1D*>(hbiasNorm[1]);
h1->SetLineColor(kRed);
h1->Draw("HIST SAMES");
TLegend* l1 = new TLegend(0.1, 0.75, 0.5, 0.9,
"plateau parameter", "ndc");
l1->AddEntry(h0, Form("histogram: mean = %4.2f RMS = \
%4.2f", h0->GetMean(), h0->GetRMS()), "l");
l1->AddEntry(h1, Form("binomial : mean = %4.2f RMS = \
%4.2f", h1->GetMean(), h1->GetRMS()), "l");
l1->Draw();
c1->cd(2);
h0 = dynamic_cast<TH1D*>(hbiasThreshold[0]);
h0->Draw("HIST");
h1 = dynamic_cast<TH1D*>(hbiasThreshold[1]);
h1->SetLineColor(kRed);
h1->Draw("HIST SAMES");
TLegend* l2 = new TLegend(0.1, 0.75, 0.5, 0.9,
"threshold parameter", "ndc");
l2->AddEntry(h0, Form("histogram: mean = %4.2f RMS = \
%4.2f", h0->GetMean(), h0->GetRMS()), "l");
l2->AddEntry(h1, Form("binomial : mean = %4.2f RMS = \
%4.2f", h1->GetMean(), h1->GetRMS()), "l");
l2->Draw();
c1->cd(3);
h0 = dynamic_cast<TH1D*>(hbiasWidth[0]);
h0->Draw("HIST");
h1 = dynamic_cast<TH1D*>(hbiasWidth[1]);
h1->SetLineColor(kRed);
h1->Draw("HIST SAMES");
TLegend* l3 = new TLegend(0.1, 0.75, 0.5, 0.9, "width parameter", "ndc");
l3->AddEntry(h0, Form("histogram: mean = %4.2f RMS = \
%4.2f", h0->GetMean(), h0->GetRMS()), "l");
l3->AddEntry(h1, Form("binomial : mean = %4.2f RMS = \
%4.2f", h1->GetMean(), h1->GetRMS()), "l");
l3->Draw();
c1->cd(4);
hChisquared->Draw("HIST");
}
|
|
