void graph() {
here.
TCanvas *c1 = new TCanvas("c1","A Simple Graph Example",200,10,700,500);
c1->SetFillColor(42);
c1->SetGrid();
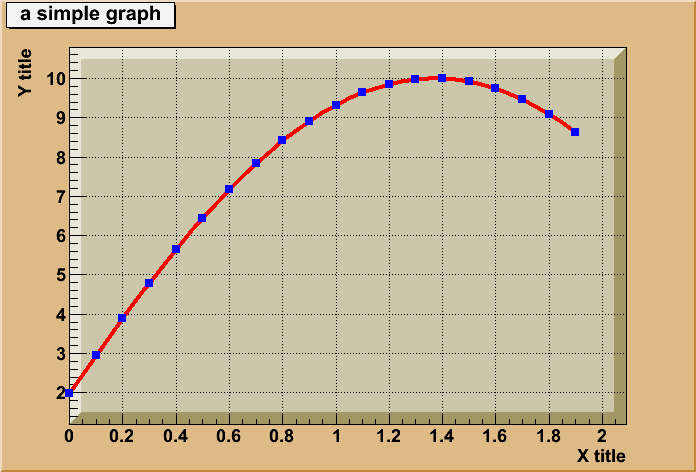
const Int_t n = 20;
Double_t x[n], y[n];
for (Int_t i=0;i<n;i++) {
x[i] = i*0.1;
y[i] = 10*sin(x[i]+0.2);
printf(" i %i %f %f \n",i,x[i],y[i]);
}
gr = new TGraph(n,x,y);
gr->SetLineColor(2);
gr->SetLineWidth(4);
gr->SetMarkerColor(4);
gr->SetMarkerStyle(21);
gr->SetTitle("a simple graph");
gr->GetXaxis()->SetTitle("X title");
gr->GetYaxis()->SetTitle("Y title");
gr->Draw("ACP");
c1->Update();
c1->GetFrame()->SetFillColor(21);
c1->GetFrame()->SetBorderSize(12);
c1->Modified();
}
|
|