void surfaces() {
here
TCanvas *c1 = new TCanvas("c1","Surfaces Drawing Options",200,10,700,900);
c1->SetFillColor(42);
gStyle->SetFrameFillColor(42);
title = new TPaveText(.2,0.96,.8,.995);
title->SetFillColor(33);
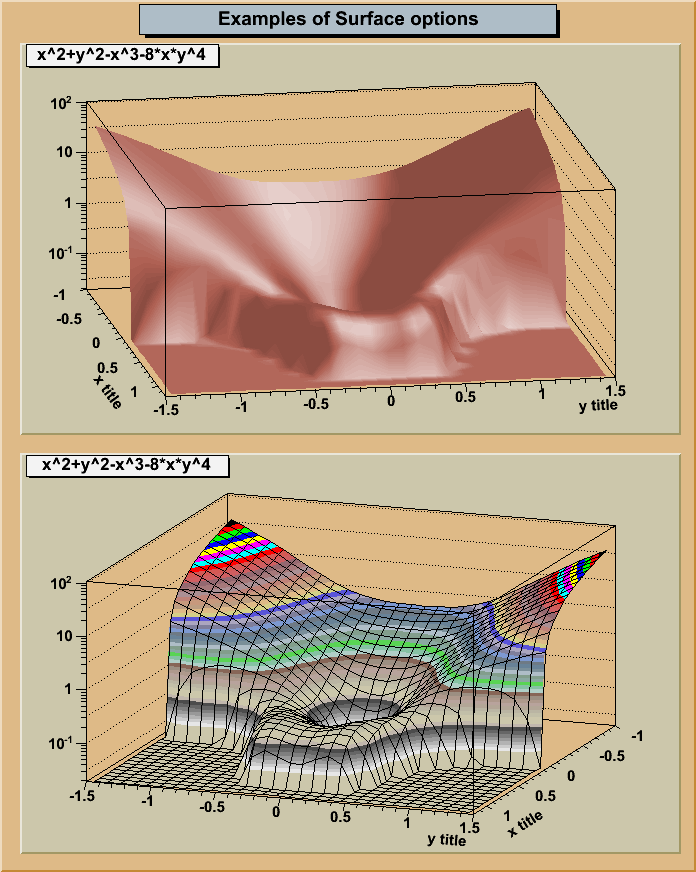
title->AddText("Examples of Surface options");
title->Draw();
pad1 = new TPad("pad1","Gouraud shading",0.03,0.50,0.98,0.95,21);
pad2 = new TPad("pad2","Color mesh",0.03,0.02,0.98,0.48,21);
pad1->Draw();
pad2->Draw();
TF2 *f2 = new TF2("f2","x**2 + y**2 - x**3 -8*x*y**4",-1,1.2,-1.5,1.5);
f2->SetContour(48);
f2->SetFillColor(45);
pad1->cd();
pad1->SetPhi(-80);
pad1->SetLogz();
f2->Draw("surf4");
pad2->cd();
pad2->SetTheta(25);
pad2->SetPhi(-110);
pad2->SetLogz();
f2->Draw("surf1");
pad2->Update();
f2->GetHistogram()->GetXaxis()->SetTitle("x title");
f2->GetHistogram()->GetYaxis()->SetTitle("y title");
f2->GetHistogram()->GetXaxis()->SetTitleOffset(1.4);
f2->GetHistogram()->GetYaxis()->SetTitleOffset(1.4);
pad1->Modified();
pad2->Modified();
}
|
|