#include "TSPlot.h"
#include "TTree.h"
#include "TH1.h"
#include "TCanvas.h"
#include "TFile.h"
#include "TPaveLabel.h"
#include "TPad.h"
#include "TPaveText.h"
#include "Riostream.h"
void TestSPlot()
{
TString dir = gSystem->UnixPathName(gInterpreter->GetCurrentMacroName());
dir.ReplaceAll("TestSPlot.C","");
dir.ReplaceAll("/./","/");
TString dataFile = Form("%sTestSPlot_toyMC.dat",dir.Data());
TTree *datatree = new TTree("datatree", "datatree");
datatree->ReadFile(dataFile, "Mes/D:dE/D:F/D:MesSignal/D:MesBackground/D:\
dESignal/D:dEBackground/D:FSignal/D:FBackground/D");
TSPlot *splot = new TSPlot(0, 3, 5420, 2, datatree);
splot->SetTreeSelection("Mes:dE:F:MesSignal:dESignal:FSignal:MesBackground:\
dEBackground:FBackground");
Int_t ne[2];
ne[0]=500; ne[1]=5000;
splot->SetInitialNumbersOfSpecies(ne);
splot->MakeSPlot();
splot->FillSWeightsHists(25);
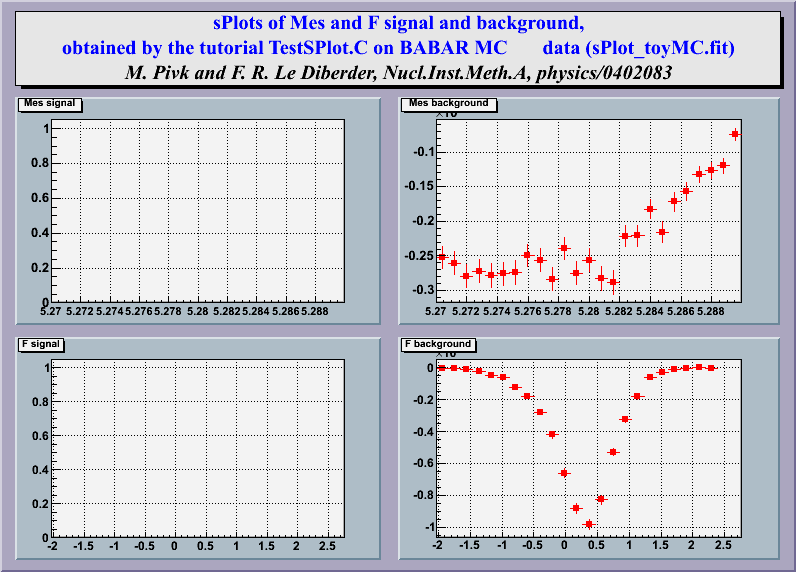
TCanvas *myc = new TCanvas("myc",
"sPlots of Mes and F signal and background", 800, 600);
myc->SetFillColor(40);
TPaveText *pt = new TPaveText(0.02,0.85,0.98,0.98);
pt->SetFillColor(18);
pt->SetTextFont(20);
pt->SetTextColor(4);
pt->AddText("sPlots of Mes and F signal and background,");
pt->AddText("obtained by the tutorial TestSPlot.C on BABAR MC \
data (sPlot_toyMC.fit)");
TText *t3=pt->AddText(
"M. Pivk and F. R. Le Diberder, Nucl.Inst.Meth.A, physics/0402083");
t3->SetTextColor(1);
t3->SetTextFont(30);
pt->Draw();
TPad* pad1 = new TPad("pad1","Mes signal",0.02,0.43,0.48,0.83,33);
TPad* pad2 = new TPad("pad2","Mes background",0.5,0.43,0.98,0.83,33);
TPad* pad3 = new TPad("pad3", "F signal", 0.02, 0.02, 0.48, 0.41,33);
TPad* pad4 = new TPad("pad4", "F background", 0.5, 0.02, 0.98, 0.41,33);
pad1->Draw();
pad2->Draw();
pad3->Draw();
pad4->Draw();
pad1->cd();
pad1->SetGrid();
TH1D *sweight00 = splot->GetSWeightsHist(-1, 0, 0);
sweight00->SetTitle("Mes signal");
sweight00->SetStats(kFALSE);
sweight00->Draw("e");
sweight00->SetMarkerStyle(21);
sweight00->SetMarkerSize(0.7);
sweight00->SetMarkerColor(2);
sweight00->SetLineColor(2);
sweight00->GetXaxis()->SetLabelSize(0.05);
sweight00->GetYaxis()->SetLabelSize(0.06);
sweight00->GetXaxis()->SetLabelOffset(0.02);
pad2->cd();
pad2->SetGrid();
TH1D *sweight10 = splot->GetSWeightsHist(-1, 1, 0);
sweight10->SetTitle("Mes background");
sweight10->SetStats(kFALSE);
sweight10->Draw("e");
sweight10->SetMarkerStyle(21);
sweight10->SetMarkerSize(0.7);
sweight10->SetMarkerColor(2);
sweight10->SetLineColor(2);
sweight10->GetXaxis()->SetLabelSize(0.05);
sweight10->GetYaxis()->SetLabelSize(0.06);
sweight10->GetXaxis()->SetLabelOffset(0.02);
pad3->cd();
pad3->SetGrid();
TH1D *sweight02 = splot->GetSWeightsHist(-1, 0, 2);
sweight02->SetTitle("F signal");
sweight02->SetStats(kFALSE);
sweight02->Draw("e");
sweight02->SetMarkerStyle(21);
sweight02->SetMarkerSize(0.7);
sweight02->SetMarkerColor(2);
sweight02->SetLineColor(2);
sweight02->GetXaxis()->SetLabelSize(0.06);
sweight02->GetYaxis()->SetLabelSize(0.06);
sweight02->GetXaxis()->SetLabelOffset(0.01);
pad4->cd();
pad4->SetGrid();
TH1D *sweight12 = splot->GetSWeightsHist(-1, 1, 2);
sweight12->SetTitle("F background");
sweight12->SetStats(kFALSE);
sweight12->Draw("e");
sweight12->SetMarkerStyle(21);
sweight12->SetMarkerSize(0.7);
sweight12->SetMarkerColor(2);
sweight12->SetLineColor(2);
sweight12->GetXaxis()->SetLabelSize(0.06);
sweight12->GetYaxis()->SetLabelSize(0.06);
sweight02->GetXaxis()->SetLabelOffset(0.01);
myc->cd();
}
|
|
