This chapter explains how to work with the following OpenGL tools:
“ogldebug—The OpenGL Debugger” lets you use a graphical user interface to trace and examine OpenGL calls.
“The OpenGL Character Renderer (GLC)” lets you render characters in OpenGL programs.
“The OpenGL Stream Utility (GLS)” is a facility for encoding and decoding streams of 8-bit bytes that represent sequences of OpenGL commands.
“glxinfo—The glx Information Utility” provides information on GLX extensions and OpenGL capable visuals, and the OpenGL renderer of an X server.
The first section describes platform limitations.
Currently, the ogldebug, GLC, and GLS tools are only supported on SGI IRIX systems while the glxinfo tool is supported on both IRIX and Linux systems.
Depending on customer demand, the tools ogldebug and GLS may be supported on Linux systems in the future. The GLC tool is obsolete, although still supported on IRIX systems. There are several alternative, open source toolkits for high-quality font rendering in OpenGL. You should migrate applications to one of those alternatives.
This section explains how to debug graphics applications with the OpenGL debugging tool ogldebug. The following topics are described:
The ogldebug tool helps you find OpenGL programming errors and discover OpenGL programming style that may slow down your application. After finding an error, you can correct it and recompile your program. Using ogldebug, you can perform the following actions at any point during program execution:
Set a breakpoint for all occurrences of a given OpenGL call.
Step through (or skip) OpenGL calls.
Locate OpenGL errors.
For a selected OpenGL context, display information about OpenGL state, current display lists, and the window that belongs to the application you are debugging.
Create a history (trace) file of all OpenGL calls made. The history file is a GLS file, which contains comments and performance hints. You can convert it to valid C code using ogldebug command-line options.

Note: If you are debugging a multiwindow or multicontext application, ogldebug starts a new session (a new window appears) each time the application starts a new process. In each new window, the process ID is displayed in the title bar.
The OpenGL debugger is not a general-purpose debugger. Use dbx and related tools such as cvd (CASEVision/Workshop Debugger) to find problems in the nonOpenGL portions of a program.
The OpenGL debugger works in the folllowing manner:
You invoke ogldebug for an application using the appropriate command line options (see “ogldebug Command-Line Options”).
A special library (libogldebug.so) intercepts all OpenGL calls using the OpenGL streams mechanism. It interprets calls to OpenGL only and filters GLU, GLC, and GLX calls. GLU calls are parsed down to their OpenGL calls; the actual GLU calls are lost.
You can run, halt, step, and trace each process in the application separately using the ogldebug graphical interface.
After ogldebug-related processing, the actual OpenGL calls are made as they would have been if ogldebug had not been present.
This section describes how to set up and start ogldebug and lists available command-line options.
Before you can use ogldebug, you must install the gl_dev.sw.ogldebug (or gl_dev.sw64.debug) subsystem. You can use the Software Manager option from the Toolchest menu on the IRIX desktop or execute swmgr from the command line. Consider also installing gl_dev.man.ogldebug to have access to the man page.
The ogldebug version that is shipped with IRIX 6.5 has a number of command-line options, which are shown in Table 14-1. The options are also listed in the ogldebug man page.
Table 14-1. Command-Line Options for ogldebug
Option | Description |
|---|---|
–display display | Set the display for the ogldebug user interface. If –display is not specified, ogldebug will use $DISPLAY. |
–appdisplay display | Set the display for the application. |
–glsplay gls_trace_file | Play back a GLS trace file recorded by ogldebug. Note that a GLS trace file is not standard C. |
–gls2c gls_trace_file | Convert a GLS trace file to a C code snippet. Output is to stdout. |
–gls2x gls_trace_file | Convert a GLS trace file to an X Window System program that can be compiled. Output is to stdout. |
–gls2glut gls_trace_file | Convert a GLS trace file to a GLUT program that can be compiled. Output is to stdout. |
To debug your OpenGL program, type the appropriate command line for your executable format:
| o32 | % ogldebug options o32program_name program_options | |
| n32 | % ogldebug32 options n32program_name program_options | |
| 64 | % ogldebug64 options 64program_name program_options |
The following describes the parameters:
| options | Any of the options listed under “ogldebug Command-Line Options”. | |||
| program_name | The name of your (executable) application. | |||
| program_options | Application-specific options, if any.
|
The ogldebug tool becomes active when the application makes its first OpenGL call. Each ogldebug main window represents a different application process. If the application uses fork, sproc, or pthread, multiple ogldebug windows may appear.
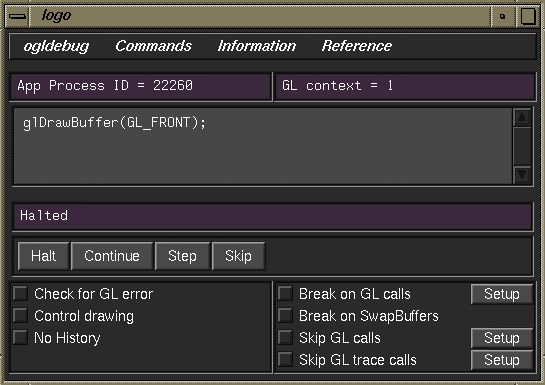
The debugger launches your application and halts execution just before the application's first OpenGL call. The main window (see Figure 14-1) lets you interact with your application's current process and displays information about the process.
The following are display areas below the menu bar:
| Context information | Displays the current process for that window (multiple processes have multiple windows) and the current OpenGL context. | |
| OpenGL call display | Below the status display area is the OpenGL call display area. This area shows the next OpenGL command to be executed. | |
| Status display | Immediately above the row of buttons is a one-line status display field, where ogldebug posts confirmation of commands and other status indicators. |
Below the row of buttons are checkboxes, described in “Using Check boxes”.
This section provides more detailed information on working with ogldebug. The following topics are described:
Additional information is available in the sections “Creating a Trace File to Discover OpenGL Problems” and “Using Menus to Interact With ogldebug”.
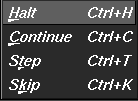
You can perform all basic interaction using the row of buttons just above the check boxes. You can access the same commands using the Commands menu. This section describes each command, including the keyboard shortcut (also listed in the Commands menu).
Table 14-2. Command Buttons and Shortcuts
Command | Result |
|---|---|
Halt Ctrl+H | Temporarily stops the application at the next OpenGL call. All state and program information is retained so you can continue execution if you wish. |
Continue Ctrl+C | Resumes program execution after execution has been stopped (such as after encountering a breakpoint or after you used the Halt or Step command). The program continues running until it reaches another breakpoint or until you explicitly halt it. The display will only be updated when the application stops again. |
Step | Continues executing up to the next OpenGL call, then stops before executing that call. |
Skip | Skips over the current OpenGL call. Useful if you think the current call contains an error or is likely to cause one. The program executes until it reaches the next OpenGL call, then stops. |
The check boxes at the bottom of the ogldebug window allow finer control over how information is collected. Check boxes let you determine when a break occurs and which API calls you want to skip.
Table 14-3 explains what happens for each of these boxes if it is checked.
Table 14-3. ogldebug Check Boxes
Check box | Description |
|---|---|
Check for GL error | Calls glGetError() after every OpenGL call to check for errors. Note that glGetError() cannot be called between glBegin() and glEnd() pairs. glGetError() is called until all errors are clear. |
Control drawing | Allows you to inspect drawing in progress (forces front buffer rendering). Also, allows you to control drawing speed. |
No history | Does not record history of the OpenGL call. As a result, the program runs faster but you cannot look at history information. |
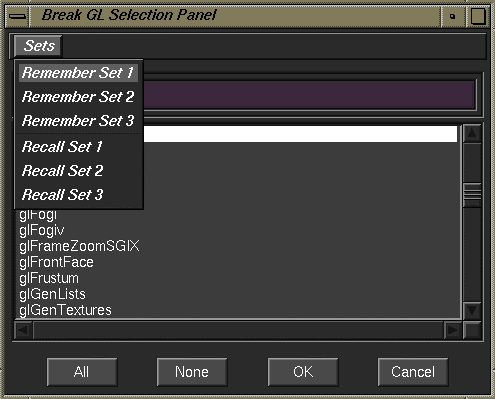
Break on GL calls | Halts on selected Open GL calls. Use the adjacent Setup button to select which calls to skip (see Figure 14-2 ). In the Break on GL calls Setup box, glFlush() is selected by default but is not active unless the Break on GL calls check box is selected. |
Break on SwapBuffers | Halts on calls that swap buffers. There is no window-system-independent call that swaps buffers; the debugger halts on the appropriate call for each platform (for example. glxSwapBuffers() for X Window System applications). |
Skip GL calls | Skips selected OpenGL calls. Use the adjacent Setup button to select which calls to skip. |
Skip GL trace calls | Does not write selected OpenGL calls to the trace file. Use the adjacent Setup button to select which calls you do not want traced. |
Figure 14-2 shows a setup panel. Inside any setup panel, you can use the standard Shift, Ctrl, and Shift+Ctrl keystrokes for multiple item selection and deselection.
To save and recall up to three custom selection/deselection areas, use the Sets menu in the setup panel for Break on OpenGL calls, Skip GL calls, and Skip GL trace calls.
A trace file helps you find bugs in the OpenGL portion of your code without having to worry about the mechanics of window operations. The following is an example of how to collect one frame of OpenGL calls:
Launch ogldebug as follows:
% ogldebug your_program_name
Be sure to use the appropriate options,; see “ogldebug Command-Line Options”.
Run until the application has passed the point of interest. You can do either of these substeps:
Click the Break on SwapBuffers checkbox.
Click the Break (API calls) checkbox to select it, then click the Setup button next to it and choose glFlush() in the Break Selection panel.
From the Information menu, select Call History.
The ogldebug tool presents a panel that lets you select which OpenGL context you want to trace. Depending on the application, more than one context may be available.
Select the OpenGL context you want to trace.
A Call History panel appears to show a list of all OpenGL contexts in the application. Double-clicking the context will show an additional window with all calls from that context. You can examine the call history in the panel or save it as a GLS trace file using the Save button at the bottom of the panel.
A GLS trace is meant to be pure OpenGL and to be window-system-independent. However, comments indicate where GLX, GLU, and GLC calls were made. Any OpenGL calls made from within these higher-level calls are indented. Performance hints are also included in the trace file, as in the following example:
...

glEnable(GL_LIGHTING);
glEnable(GL_LIGHT0);
glEnable(GL_AUTO_NORMAL);
glEnable(GL_NORMALIZE);
glMaterialfv(GL_FRONT, GL_AMBIENT, {0.1745, 0.01175, 0.01175,
             2.589596E-29});
glsString(“Info”, “For best performance, set up material parameters
           first, then enable lighting.”);

...
At this point, you have several options:
Play back (re-execute) the GLS trace file with the -glsplay option.
Convert the GLS trace file to a C file by invoking ogldebug with the -gls2c, -gls2x, or -gls2glut option. Any comments or performance hints are removed during the conversion.
For larger applications, such as OpenGL Performer, consider using the no-history feature. If you need to run the application to a particular point and do not care about the call history until that point, turn on the no-history feature to speed things up.
As you work with ogldebug, you may find it useful to save and reload certain settings. You can save and reload groups of ogldebug settings as follows:
To save settings, choose Save Configuration from the File menu, then enter a filename using the resulting dialog box.
To load settings, choose Load Configuration from the File menu, then select a file using the resulting dialog box.
This section describes how you can interact with ogldebug using menus. The following tasks are described:
The File menu (shown in Figure 14-3) gives version information, lets you save and reload a configuration file, and stops ogldebug.
The Commands menu gives you access to commands that control ogldebug execution.The commands are described in “Interacting With ogldebug”.
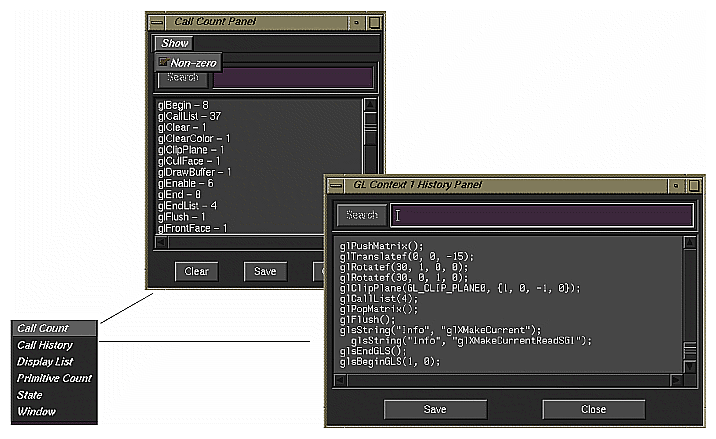
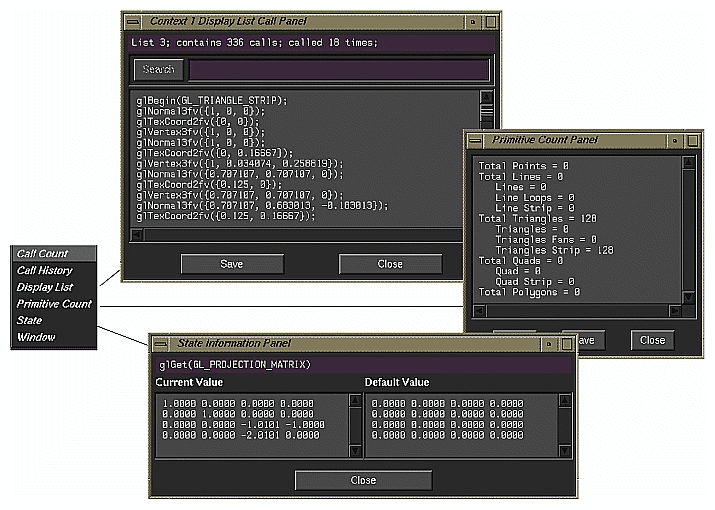
The following two illustrations show the windows in which ogldebug displays information. A table that explains the functionality follows each illustration.
The following is a brief description of the Call Count and Call History menu commands:
| Call Count | Brings up a window with counts for OpenGL, GLU, GLX, and GLC calls. You can show a count for all OpenGL functions or only for functions that were called at least once (nonzero calls). | |
| Call History | Brings up a window with a history of OpenGL calls (as a GLS trace). |
The following is a brief description of the menu commands:
| Display List | First prompts for a context, then brings up a window with information about the application's display lists, if any, for that context. You can show all or only non-empty display lists. | |
| Primitive Count | Provides the number of all primitives sent by the application so far (for example, quads, polygons, and so on). Whether they are clipped or not is not reported. | |
| State | Brings up a window that displays information on OpenGL state variables. You can show all or only nondefault state. Note that you cannot query state between glBegin() and glEnd() pairs. | |
| Window | (not shown)Brings up window information for the application you are running from ogldebug. |
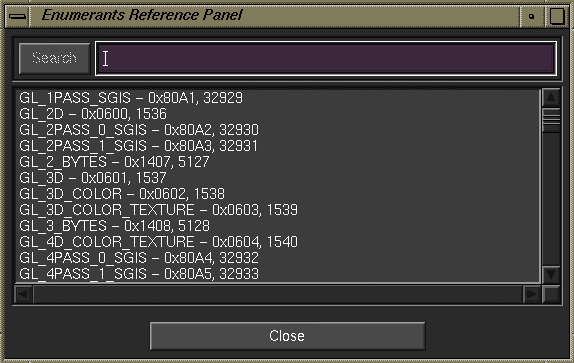
The References menu provides access to the Enumerants menu command only. If you choose Enumerants, a window displays a list of the symbolic names of OpenGL enumerated constants together with the actual number (in hexadecimal and decimal) that each name represents (See Figure 14-7).
The OpenGL Character Renderer (GLC) is a platform-independent character renderer that offers the following benefits:
Convenient to use for simple applications.
Can scale and rotate text and draw text using lines, filled triangles, or bitmaps.
Supports international characters.
For a basic discussion of GLC and a list of notes and known bugs for the current implementation, see the glcintro man page.
The most authoritative documentation on GLC is the GLC specification document, which is usually included in each OpenGL release in PostScript form. If you install the software product gl_dev.sw.samples, the GLC specification is installed as the following file:
/usr/share/src/OpenGL/teach/glc/glcspec.ps |
The OpenGL Stream Codec (GLS) is a facility for encoding and decoding streams of 8-bit bytes that represent sequences of OpenGL commands. This section starts with an overview of GLS, then describes “glscat Utility”, which allows you to concatenate GLS streams.
GLS can be used for a variety of purposes—the following, for example:
Scalable OpenGL pictures—GLS facilitates resolution-independent storage, interchange, viewing, and printing.
Persistent storage of OpenGL commands, display lists, images, and textures.
Communication—Command transfer between application processes through byte-stream connections.
Client-side display lists—Can contain client data or callbacks.
Tracing—Useful for debugging, profiling, and benchmarking.
Some of these applications require the definition and implementation of higher-level APIs that are more convenient to use than the GLS API. The GLS API provides only the basic encoding and decoding services that allow higher-level services to be built on top of it efficiently.
The GLS specification has two components:
A set of three byte-stream encodings for OpenGL and GLS commands: human-readable text, big-endian binary, and little-endian binary. The three encodings are semantically identical; they differ only in syntax. Therefore, it is possible to convert GLS byte streams freely among the three encodings without loss of information.
An API that provides commands for encoding and decoding GLS byte streams. This API is not formally an extension of the OpenGL API. Like the GLU API, the GLS API is designed to be implemented in an optional, standalone client-side subroutine library that is separate from the subroutine library that implements the OpenGL API.
The GLS encodings and API are independent of platform and window system. In particular, the GLS encodings are not tied to the X Window System protocol encoding used by the GLX extension. GLS is designed to work equally well in UNIX, Windows, and other environments.
For more information, see the glsintro man page.
The glscat utility (/usr/sbin/glscat) allows you to concatenate GLS streams. Enter glscat -h at the command line for a list of command-line parameters and options.
In its simplest usage, glscat copies a GLS stream from standard input to standard output:
glscat < stream1.gls > stream2.gls |
As an alternative to standard input, one or more named input files can be provided on the command line. If multiple input streams are provided, GLS will concatenate them:
glscat stream1.gls stream2.gls > stream3.gls |
Use the -o outfile option to specify a named output file as an alternative to standard output:
glscat –o stream2.gls < stream1.gls
In all cases, the input stream is decoded and re-encoded, and errors are flagged. By default, the type of the output stream (GLS_TEXT, GLS_BINARY_MSB_FIRST, or GLS_BINARY_LSB_FIRST) is the same as the type of the input stream.
The most useful option to glscat is the -t type, which lets you control the type of the output stream. The type parameter is a single-letter code, one of the following:
| t | Text | |
| b | Native binary | |
| s | Swapped binary | |
| l | LSB-first binary | |
| m | MSB-first binary |
For example, the following command converts a GLS stream of any type to text format:
glscat -t t < stream1.gls > stream2.gls |
The glxinfo utility lists information about the GLX extension, OpenGL capable visuals, and the OpenGL renderer of an X server. The GLX and render information includes the version and extension attributes. The visual information lists the GLX visual attributes for each OpenGL capable visual (for example whether the visual is double-buffered, the component sizes, and so on). For more information, try the command or see the glxinfo man page.
