#include "TGraphErrors.h"
#include "TGraph2DErrors.h"
#include "TCanvas.h"
#include "TF2.h"
#include "TH1.h"
#include "TVirtualFitter.h"
#include "TRandom.h"
void ConfidenceIntervals()
{
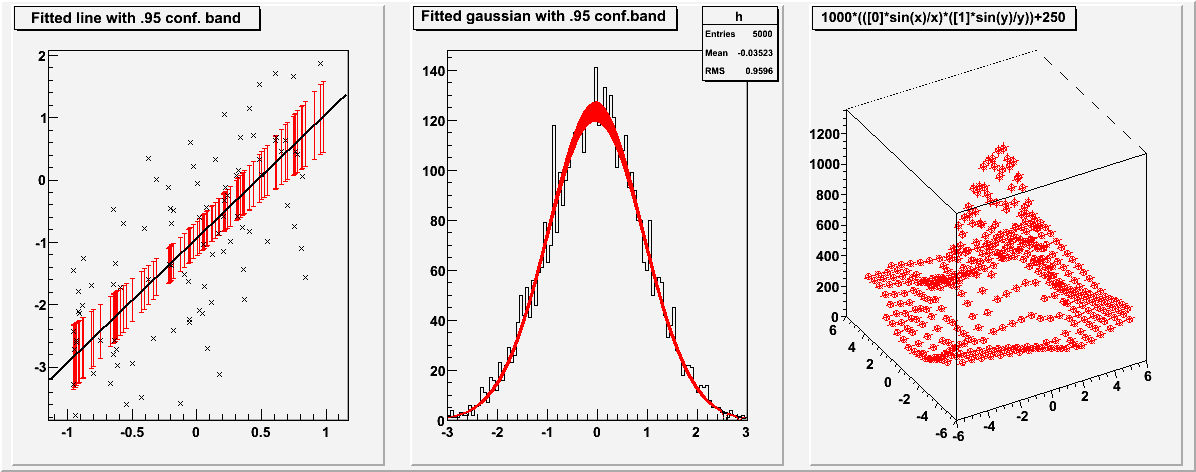
TCanvas *myc = new TCanvas("myc",
"Confidence intervals on the fitted function",1200, 500);
myc->Divide(3,1);
Int_t ngr = 100;
TGraph *gr = new TGraph(ngr);
Double_t x, y;
Int_t i;
for (i=0; i<ngr; i++){
x = gRandom->Uniform(-1, 1);
y = -1 + 2*x + gRandom->Gaus(0, 1);
gr->SetPoint(i, x, y);
}
TF1 *fpol = new TF1("fpol", "pol1", -1, 1);
fpol->SetLineWidth(2);
gr->Fit(fpol, "Q");
TGraphErrors *grint = new TGraphErrors(ngr);
grint->SetTitle("Fitted line with .95 conf. band");
for (i=0; i<ngr; i++)
grint->SetPoint(i, gr->GetX()[i], 0);
(TVirtualFitter::GetFitter())->GetConfidenceIntervals(grint);
myc->cd(1);
grint->SetLineColor(kRed);
grint->Draw("ap");
gr->SetMarkerStyle(5);
gr->SetMarkerSize(0.7);
gr->Draw("psame");
myc->cd(2);
Int_t nh=5000;
TH1D *h = new TH1D("h",
"Fitted gaussian with .95 conf.band", 100, -3, 3);
h->FillRandom("gaus", nh);
TF1 *f = new TF1("fgaus", "gaus", -3, 3);
f->SetLineWidth(2);
h->Fit(f, "Q");
h->Draw();
TH1D *hint = new TH1D("hint",
"Fitted gaussian with .95 conf.band", 100, -3, 3);
(TVirtualFitter::GetFitter())->GetConfidenceIntervals(hint);
hint->SetStats(kFALSE);
hint->SetFillColor(2);
hint->Draw("e3 same");
Int_t ngr2 = 100;
Double_t z, rnd, e=0.3;
TGraph2D *gr2 = new TGraph2D(ngr2);
TF2 *f2 = new TF2("f2",
"1000*(([0]*sin(x)/x)*([1]*sin(y)/y))+250",-6,6,-6,6);
f2->SetParameters(1,1);
for (i=0; i<ngr2; i++){
f2->GetRandom2(x,y);
rnd = 2*gRandom->Rndm()*e-e;
z = f2->Eval(x,y)*(1+rnd);
gr2->SetPoint(i,x,y,z);
}
TGraph2DErrors *grint2 = new TGraph2DErrors(ngr2);
for (i=0; i<ngr2; i++)
grint2->SetPoint(i, gr2->GetX()[i], gr2->GetY()[i], 0);
f2->SetParameters(0.5,1.5);
gr2->Fit(f2, "Q");
(TVirtualFitter::GetFitter())->GetConfidenceIntervals(grint2);
myc->cd(3);
f2->SetNpx(30);
f2->SetNpy(30);
f2->SetFillColor(kBlue);
f2->Draw("surf4");
grint2->SetNpx(20);
grint2->SetNpy(20);
grint2->SetMarkerStyle(24);
grint2->SetMarkerSize(0.7);
grint2->SetMarkerColor(kRed);
grint2->SetLineColor(kRed);
grint2->Draw("E0 same");
grint2->SetTitle("Fitted 2d function with .95 error bars");
myc->cd();
}
|
|