HB Display for RICH (preliminary)
Marko Staric, IJS, Ljubljana
May 21, 2002
The following histograms are shown on HB Display for RICH during data
taking:
- Left column: Raw data histograms
- Hit distribution on upper detector (x and y units: pad size)
- Hit distribution on lower detector (x and y units: pad size)
- Number of hits per event
- Right column: Reconstruction histograms
- Ring radius for beta=1 particles (units: radians).
- Single photon Cerenkov angle residuals (units: milliradians).
- Number of identified particles (bin 0=ghosts, bin 3=pions, bin 4=kaons,
bin 5=protons).
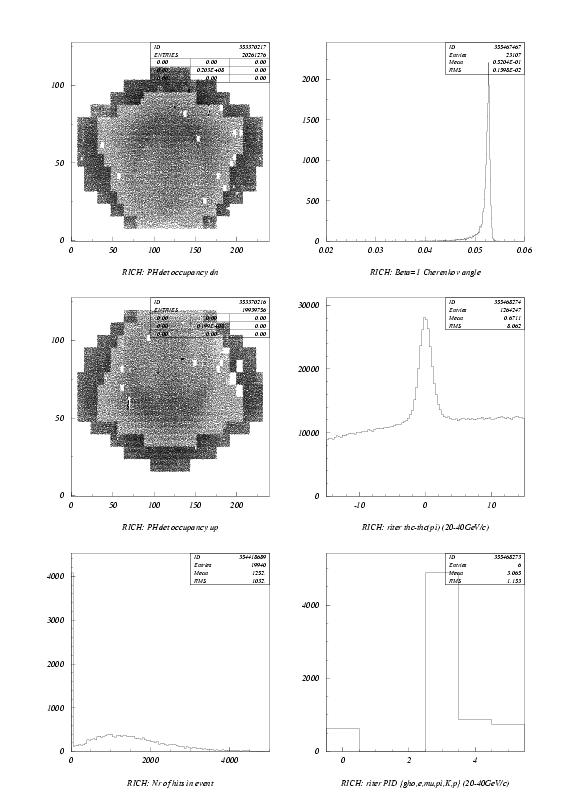
Fig. 1 shows the histograms
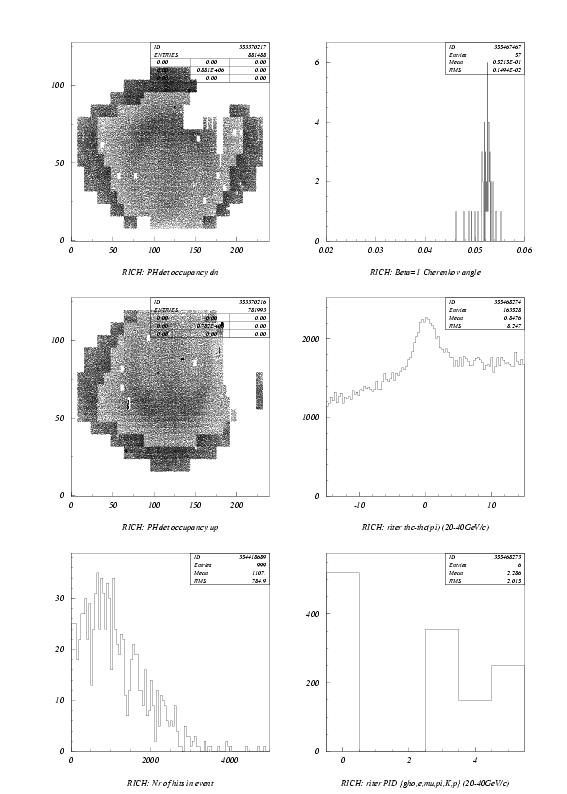
for good data, Fig. 2 shows
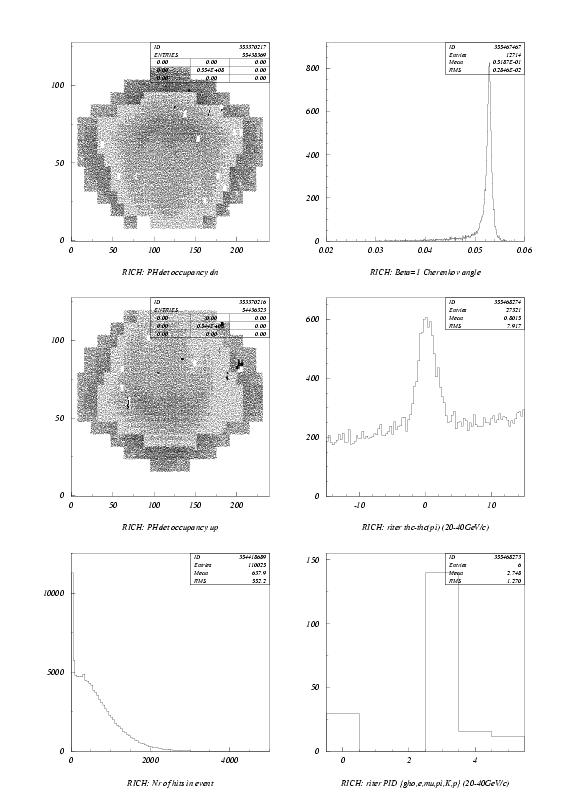
the histograms for usable/bad data and Fig. 3 shows the status on
May, 12 2002 (=data good for commissioning). Some explanations:
- Upper/lower detector is OK, if hits are
everywhere on the detector active area except on few small rectangular
parts (4 x 4 = missing/dead PMT's, approx. 20 pieces), see Fig. 1. The data quality is bad,
if larger parts of the detector are missing or could be noticed by
smaller/larger occupancy. The shape of those parts could be:
rectangular, L-shaped, in form of vertical strips or irregular
(like on Fig. 2). The reason
is either a.) some FED's have wrong ID or the data is
missing/corrupted, b.) H.V. on those parts is OFF, c.) L.V. on
those parts is OFF or threshold settings are wrong. In such
cases check Slow-control for the RICH.
- Hits per event depend on the interaction rate and trigger conditions.
The electronics noise level is negligible for RICH,
thus empty events are showing up in the leftmost bin of the plot.
If the distribution is shifted to the right, the noise level has increased
considerably. Check L.V. and threshold settings in Slow-control.
- Ring radius is typically 0.052. It depends on the gas pressure,
temperature and freon content. Variations of 3% are possible.
The radius should not be considerably below 0.050.
- Residuals should have sigma of about 1 mrad (= 8 bins FWHM).
The peak should be positioned at 0.
The signal-to-background ratio depends on the interaction rate and
trigger conditions. Normally, it is better than 1:1.
- Identified particles should be mostly pions (bin at 3).
Approximate fractions should be Pions:Kaons:Protons = 70%:15%:15%,
with additional 10% to 20% of ghosts.
Figure 1:
Good data (run 15764). Small empty rectangles are missing/dead PMT's.
 |
Figure 2:
Bad data (run 18448, interaction trigger). Large irregularly-shaped areas,
corresponding to one FED each, are empty. Note also an empty rectangle at (80,12) on
upper-left plot, which corresponds to one HV channel with HV=Off.
 |
Figure 3:
Status on Sunday, 12/05/2002 (run 18543, interaction trigger). Data quality is
good for commissioning purposes.
 |
Marko Staric
2002-05-21


