** Report on the 20150409 Am run **
The run 20150409 was a long run, collecting 20M events over eight
days of continuous running. I did an analysis on a file-by-file basis,
each file roughly encompassing a single running day, collecting 2.5M
events per file.
I was mostly interested in how the parameters (most noteably energy resolution) change over such long periods. Here detector warm-up might play a key role, and I expect a slow rise.
The analysis was performed according to processing procedure described previously.
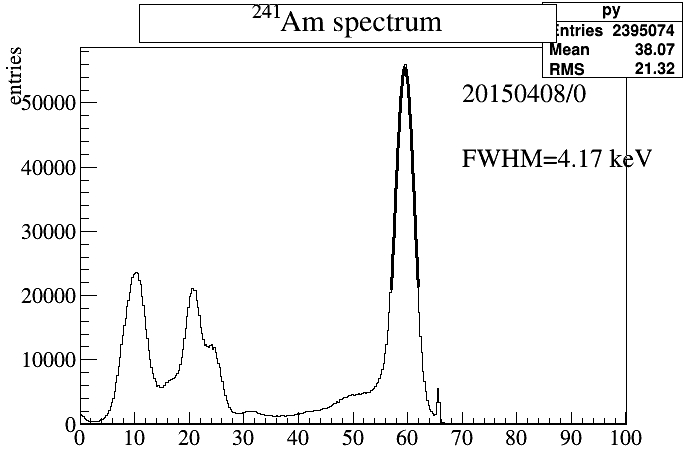


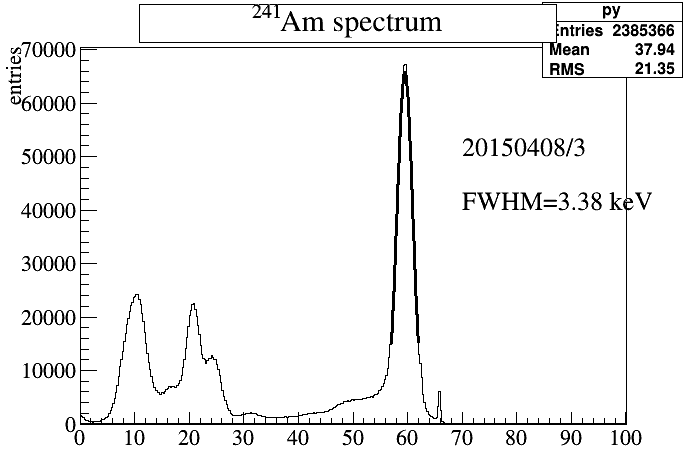
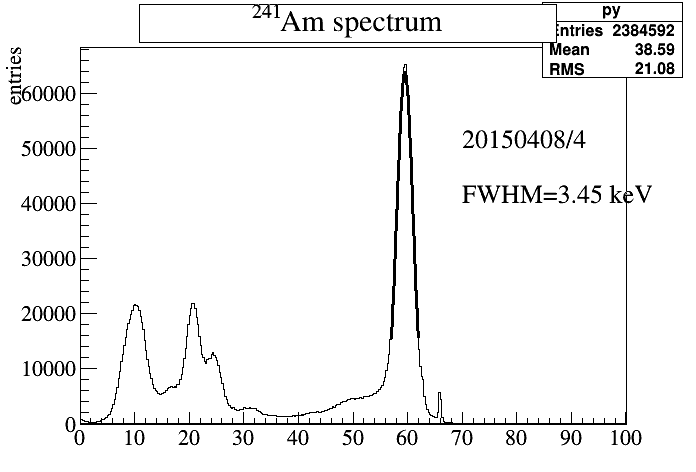
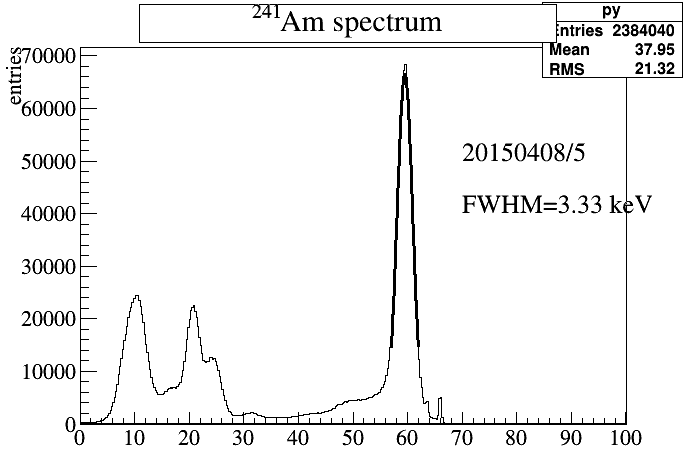


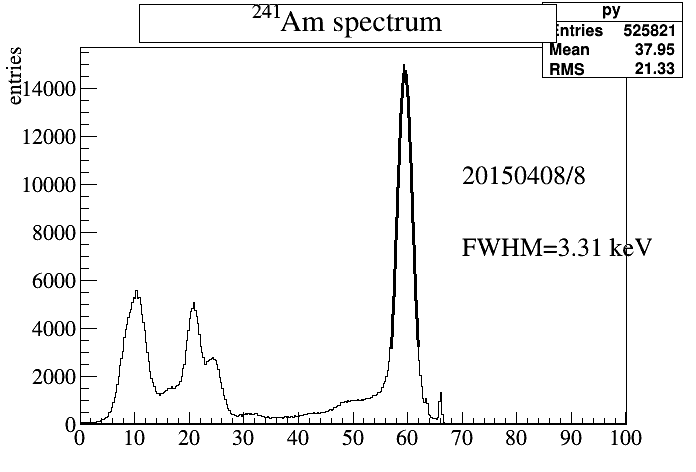
Interestingly enough, trend is not what I expected. Here is the plot
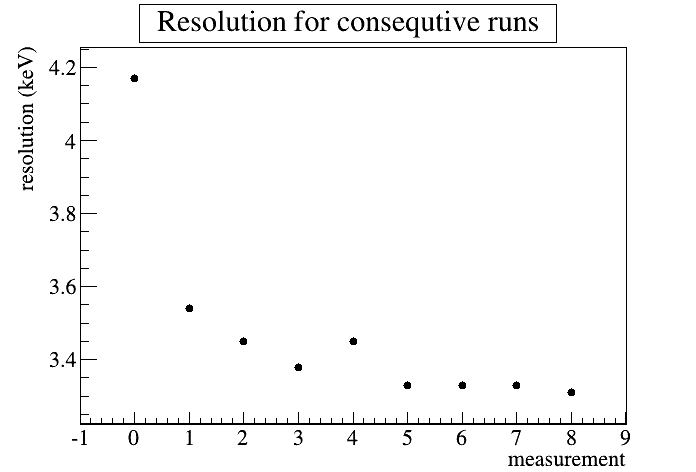
The resolution actually gets better. Each point can be nearly exactly identified with a day: 0 is Thu, Apr8, 3 is Sun, Apr12, and 8 is Fri, Apr17, and there is little correlation with weekend or weather, as the weather was stable (sunny, warm). There are probably other effects which weren't monitored (ambiental activity) which govern the resolution.