The WHY
The precise mechanism by which alterations in these cellular processes with cancer treatment lead to changes in 18F-FDG uptake is incompletely understood and may be different for different tumor types and different treatments.
Visual assessment, the easiest method, is subjective and not suitable for clinical trials in which a more objective quantitative measure is desirable, barring the uncommon occurrence of a complete response to therapy.
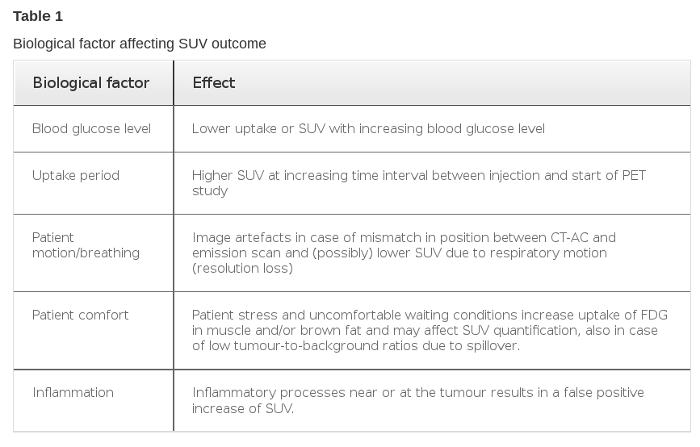
the uptake depends on the time of measurement.
The standardized uptake value (SUV) is the semiquantitative method most commonly used to determine 18F-FDG uptake in attenuation-corrected PET images.
The advantages of a full kinetic quantitative analysis, however, are that it yields an absolute rate for 18F-FDG metabolism, is independent of imaging time, and provides insight into various components of glucose metabolism such as transport and phosphorylation. Full kinetic modeling has been used infrequently [...] because of the complexity of such an approach, including patient compliance issues and the requirement for arterial blood sampling or dynamic imaging of a blood-pool structure to obtain a precise input function (13).
However, uptake in the tumors [...] may not peak or plateau until 90 or 120 min, or longer [...]
Comparisons of various kinetic modeling and semiquantitative techniques show a good correlation between absolute quantitative metabolic rate and SUV normalized to body weight, lean body mass, or body surface area.
Most PET scanners have a reconstructed image resolution of approximately 5–10 mm. However, this may be altered depending on the filtering applied before, during, or after reconstruction and on the reconstruction and display matrix sizes (27).
Threshold-determination or edge-finding algorithms are accurate and can be applied with less subjective interaction from the technician or physician determining the ROI.
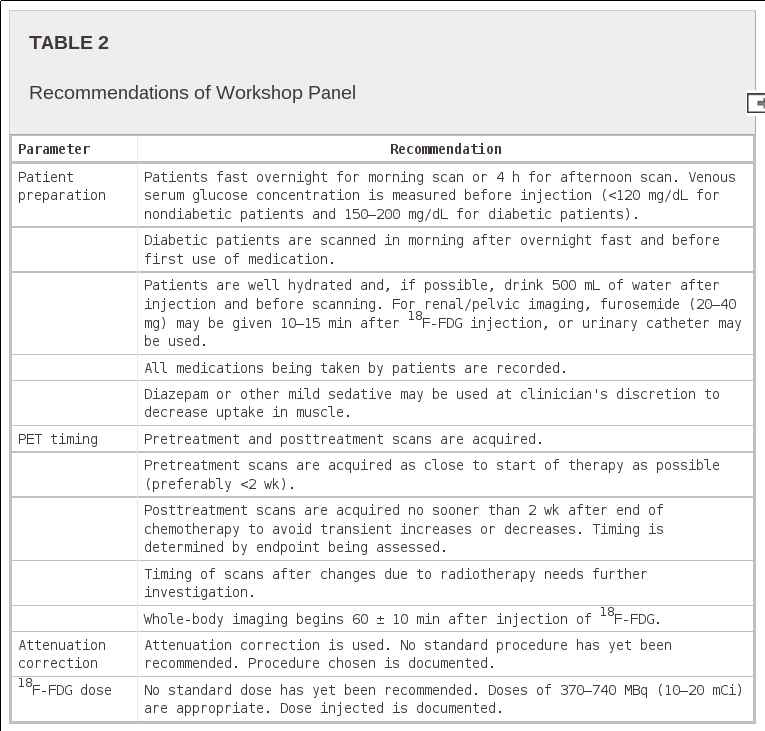
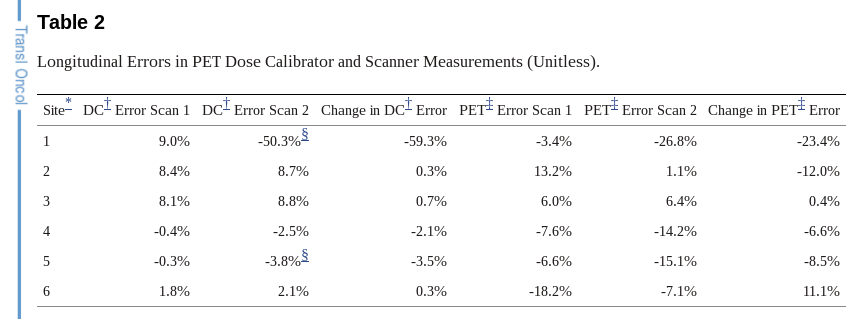
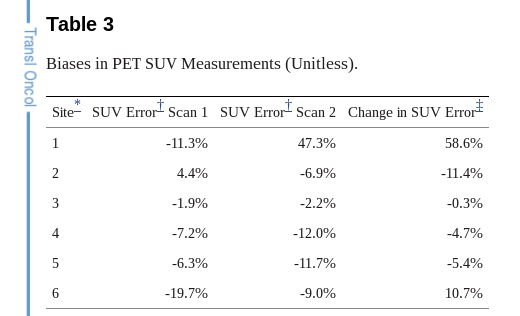
Because the specifications of PET cameras are variable and manufacturer specific, every attempt should be made to use the same scanner (ideally at the same center) or same scanner model for serial scanning of the same patient. [...] Filters, image reconstruction techniques and parameters, and application of the attenuation map must be consistent across all scanning of a given patient.
Accurate and reproducible determination of the ROI will be critical for determining SUV. The consensus of the working group was that maximum or “peak” approaches are the most robust and reproducible and that the maximum SUV and mean SUV of each tumor should be recorded. The panel strongly encouraged further cooperative studies, including work with camera manufacturers, to improve reproducibility and standardization between centers by developing more standard and automated methods of defining regions.
In fact, FDG PET/CT is exploited as an integrated biomarker (defined as a marker measured in the context of a prospective trial but not to direct switch in therapy) of early (1 to 2 weeks after treatment initiation) response in the metastatic and neoadjuvant settings, including the NeoALTTO study PET substudy, the AVATAXHER trial, and the ongoing TBCRC026 trial. (additional tag words: MBC, Neoadjuvant, Pertuzumab, Trastuzumab, Lapatinib, HER2). [...] In this regard, Lin et al and the TBCRC should be applauded for their collaborative efforts in prospectively evaluating FDG PET/CT as a potential predictive biomarker [...] in a large multicenter setting with a uniform imaging protocol and central imaging analysis.
The obvious next step for building on these data is to determine whether FDG PET/CT can serve as an integral biomarker prompting either continuation of lapatinib plus trastuzumab or the switch to an alternative treatment: the concept of “response-adapted strategy.” Notably, FDG PET/CT is routinely used as an integral biomarker of response in the management of non-Hodgkin lymphoma and esophageal cancer (25, 26)
However, despite the recent encouraging results, we await conclusive evidence that changing treatment on the basis of interim PET/CT in lymphoma definitively improves outcome (27). Similarly, although FDG PET/CT can be of prognostic value in MBC (28), future prospective studies will determine whether it can serve as a reliable surrogate response end point.
Lin et al used the European Association for Research and Treatment of Cancer response criteria that defines partial metabolic response as a 15% to 25% decrease in SUV after one cycle of treatment (29).However, a 15% decrease in SUV could be within the range of variability and thus have an impact on reproducibility (30). The Positron Emission Tomography Response Criteria in Solid Tumors (PERCIST) criteria that uses SULpeak (SUL is SUV normalized to lean body mass) and has a 30% requirement for a tumor response have set the initial framework to overcome this variability, but these also need further validation. (31). Second, although there was substantial agreement between week 1 and week 8 metabolic responses (k = 0.66) in the Lin et al study the timing of PET scans to assess early response cannot be generalized for other targeted therapies. Others have successfully evaluated FDG PET/CT 2 weeks after therapy initiation to predict treatment response (20,22,32).
The HOW
it has been shown that semiquantitative analysis (SUV) [of PET images] allows an objective assessment for lesion characterisation Freudenberg2008, prognostic stratification Geus2007 and monitoring treatment response Weber2005. The latter is generally measured by the relative change of SUV during treatment.
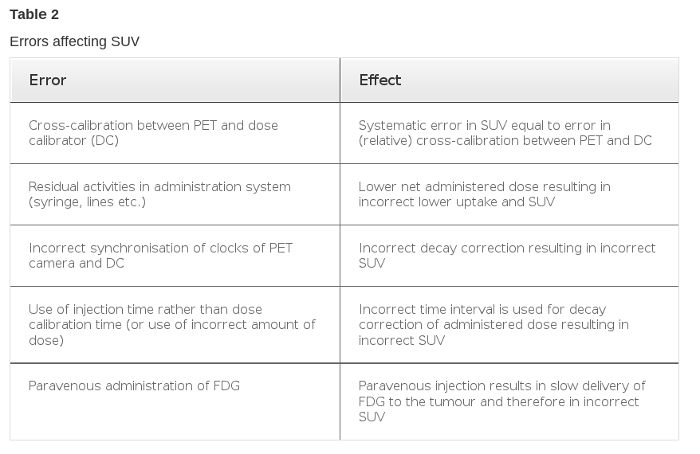
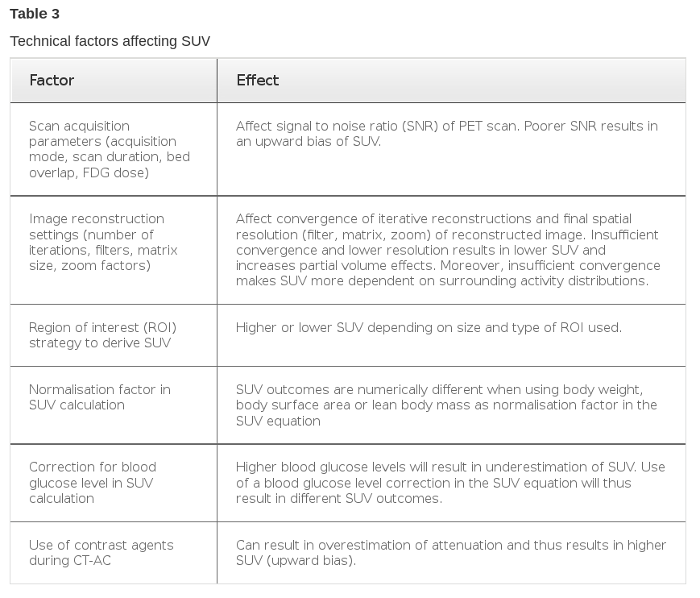
So far, it has been observed that differences between scanners and centres are within 10% provided recommendations are followed strictly.
Any change in default acquisition and reconstruction algorithm and their settings will directly have an effect on observed SUV.[...] Moreover, sufficient flexibility in changing parameter settings would be beneficial to facilitate matching of image SNR, convergence of iterative reconstruction methods and image resolution in a multicentre studies.
Another observation (data not shown) is that calibration and image quality, especially uniformity of pixel values of reconstructed images, may differ between (same) scanners of the same manufacturer at different sites.
The accumulated resulting inaccuracy led us to argue that all (small) factors contributing to variability in SUV across centres should be controlled as much as possible, and this reasoning is, in fact, the main driver of many of the presented recommendations. Based on phantom experiments (Fig. 2), inter-institute variability due to technical issues could be minimized to within 7% (1 SD) provided upon strict standardisation of PET procedures.
This work is part of the ongoing multi-center Alzheimer's Disease Neuroimaging Initiative (ADNI) project. [...] In all there were 15 different scanner-types in this project. In spite of using a standardized imaging protocol, systematic inter-scanner variability in PET images from various sites has been observed due to differences in scanner resolution, reconstruction techniques, and different implementations of scatter and attenuation corrections on the different scanner models.
The correction factors to reduce systematic inter-scanner variability were obtained from 3-D Hoffman brain phantom. [...] Resolution differences are due primarily to differences in crystal sizes, and to a lesser extent due to detector material (LSO, BGO, GSO and LYSO), detector crystal axial depths, energy windows, as well as the number of rings, crystals per ring and axial field-of-view. [...] (Additional) non-uniformities between scanners are likely to be caused primarily by disparity in the software routines that handle attenuation and scatter.
The digital Hoffman brain phantom was smoothed in all three dimensions with incremental full width half maximum (FWHM) Gaussian kernels [...] A library for each average phantom scan A$_n$ was formed by smoothing it with incremental FWHM Gaussian kernels [...] The FWHM of the smoothing kernel for the n th scanner model ($\hat{j}_n$) [was chosen to minimize]:
$$\hat{j}n=\mathrm{argmin}_j\vert\vert \bar{D}_8-\bar{A}\vert\vert_2$$
The smoothing kernel for each scanner model [...] was then applied to every human subject scan.
The following linear model was used as the [...] corrections for attenuation and scatter:
$$ D_8=a_nA_n+b_n+\epsilon_n $$
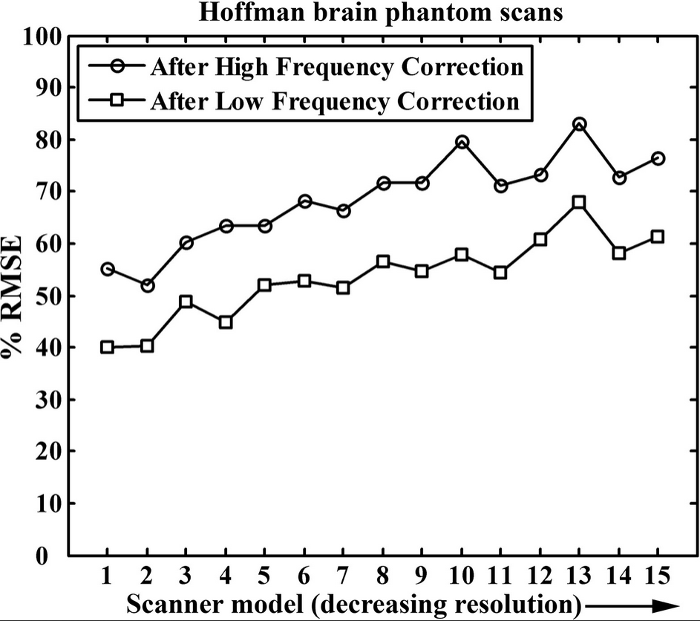
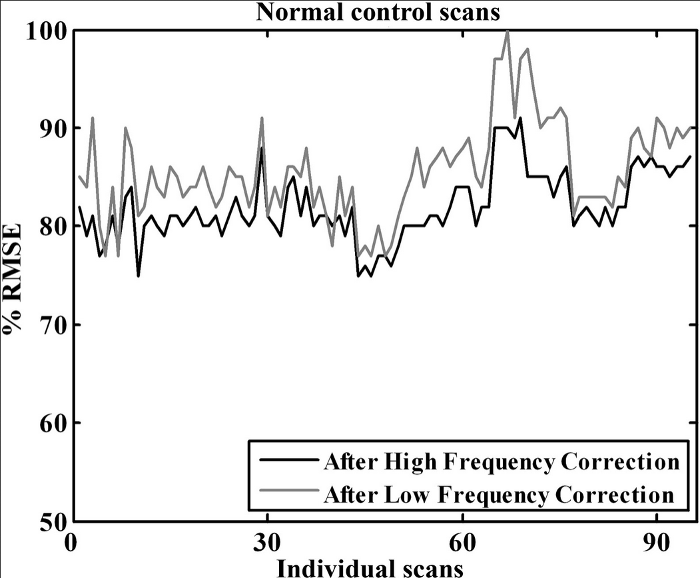
The high frequency correction kernels [...] are being used to adjust all ADNI PET image data on a routine basis.
It is well known, however, that different PET/CT scanners with corresponding image analysis platforms cannot always use common a priori parameters due to differences in algorithms and/or their implementation. This has led to the concept of harmonized image acquisition and analysis approaches, where a number of performance parameters or image characteristics (e.g. spatial resolution, signal to noise level, etc.) are first specified a posteriori in order to define required acquisition, processing and analysis settings for the different systems.
All studies were performed using a Gemini TF PET/CT scanner
The VOI methods used in this study were: a 3D isocontour at 50 % of the maximum voxel value within the tumour adjusted for local background (VOI$\mathrm{A50\%}$) [13, 17], a maximum, i.e. the voxel with the highest uptake within the tumour (VOI$\mathrm{max}$) and a 3D peak, using a spherical VOI of 1.2 cm diameter positioned around the voxel with the highest uptake (VOI$_\mathrm{3Dpeak}$) [13, 22]. The methods were implemented using software developed in-house. [...] In brief, each method is initialized by a user-defined starting point [...]
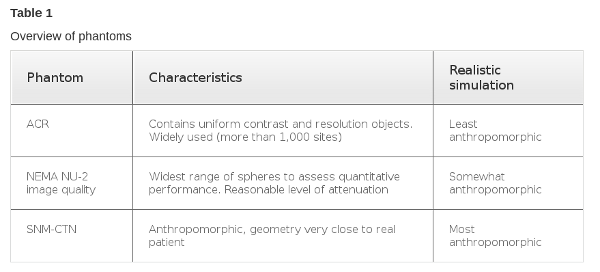
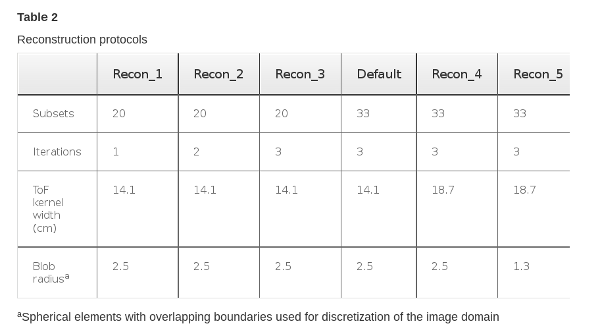
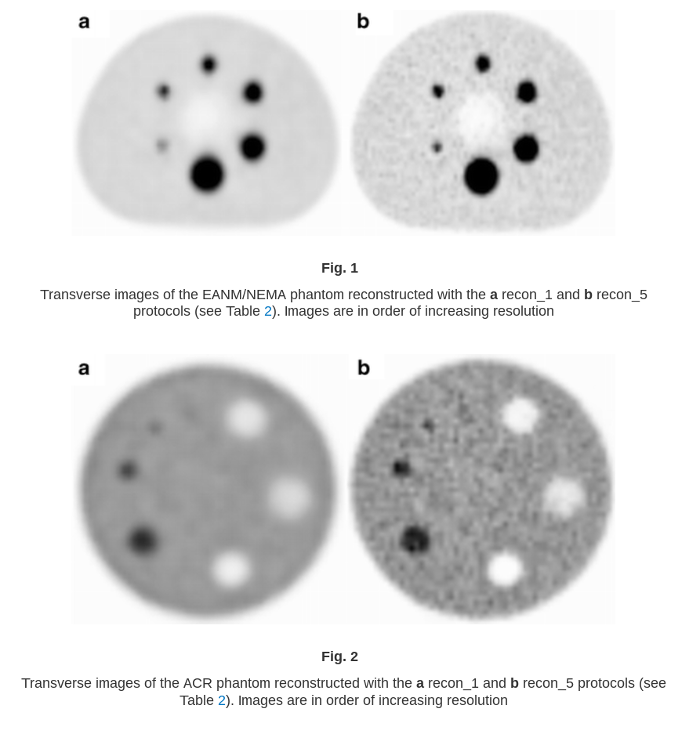
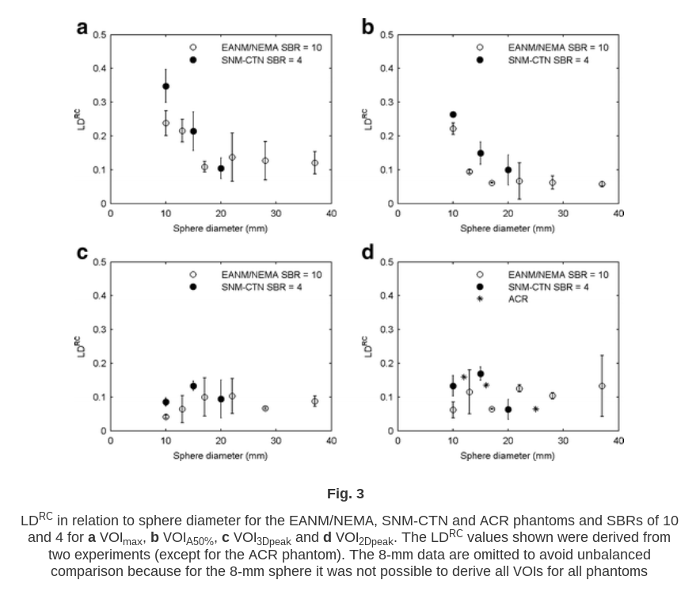
An advantage of the ACR phantom is that it is relatively easy to fill and that robust measurement specifications are provided by the ACR. Moreover, the presence of a large uniform background compartment also makes this phantom suitable for cross-calibration of the PET/CT system against the dose calibrator used for assaying administered dose in a single phantom experiment. A drawback of the ACR phantom is that the contrast objects are cylindrical and short rather than spherical, and therefore it is less sensitive to processing and image reconstruction parameters.
Because of the reduced variability of VOI$\mathrm{3Dpeak}$ in relation to image characteristics, it is suggested that VOI$\mathrm{3Dpeak}$ may be an attractive VOI method for SUV quantification in multicentre trials to compensate for residual differences in image quality and quantification after harmonization and scanner validation has been performed.
VOI$\mathrm{3Dpeak}$ and VOI$\mathrm{max}$:
Recent findings by Lodge et al. [24] also indicate that SUV based on VOI$\mathrm{3Dpeak}$ may be more robust with respect to changes in pixel size, thus making it preferable for use in multicentre studies. Moreover, SUV based on VOI$\mathrm{3Dpeak}$ may suffer less from noise-induced bias than SUV based on VOI$\mathrm{max}$ [13, 25]. Unfortunately, the method is not yet widely commercially available, and there is the potential for increased variability from fluctuations in VOI boundary locations. Therefore, the use of SUV based on VOI$\mathrm{max}$ is still required, because it is easy to obtain, is not observer-dependent and is widely available at present. [...] The latter implies that VOImax would be more sensitive to noise as well as to physiological differences in tracer uptake between lesions and between patients. Therefore, it is recommended that SUVs based on both VOI$\mathrm{Max}$ and VOI$\mathrm{3Dpeak}$ be measured such that the potential benefits and drawbacks of these two methods can be further explored, while retaining clinical feasibility [26].
